## Line Chart: Performance Metrics Across Parameters
### Overview
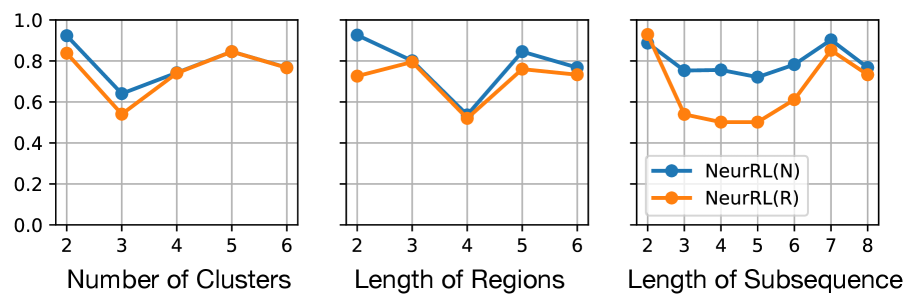
The image displays three line charts comparing the performance of two algorithms, **NeurRL(N)** (blue) and **NeurRL(R)** (orange), across three distinct parameters: **Number of Clusters**, **Length of Regions**, and **Length of Subsequence**. Each chart uses a y-axis scaled from 0.0 to 1.0 and an x-axis with discrete integer values. The charts highlight trends in performance as the parameters vary.
---
### Components/Axes
1. **X-Axes**:
- **Left Panel**: "Number of Clusters" (values: 2, 3, 4, 5, 6).
- **Middle Panel**: "Length of Regions" (values: 2, 3, 4, 5, 6).
- **Right Panel**: "Length of Subsequence" (values: 2, 3, 4, 5, 6, 7, 8).
2. **Y-Axis**: All panels share a y-axis labeled "Performance Score" (range: 0.0 to 1.0).
3. **Legends**: Located in the bottom-right corner of each panel, with:
- **Blue Circles**: NeurRL(N)
- **Orange Circles**: NeurRL(R)
---
### Detailed Analysis
#### Left Panel: Number of Clusters
- **NeurRL(N)** (blue):
- Starts at ~0.95 (x=2), dips to ~0.65 (x=3), rises to ~0.8 (x=4), fluctuates to ~0.75 (x=5), and stabilizes at ~0.8 (x=6).
- **NeurRL(R)** (orange):
- Begins at ~0.85 (x=2), drops to ~0.55 (x=3), rises to ~0.7 (x=4), dips to ~0.65 (x=5), and stabilizes at ~0.75 (x=6).
#### Middle Panel: Length of Regions
- **NeurRL(N)** (blue):
- Peaks at ~0.95 (x=2), dips to ~0.8 (x=3), fluctuates to ~0.75 (x=4), rises to ~0.85 (x=5), and stabilizes at ~0.8 (x=6).
- **NeurRL(R)** (orange):
- Starts at ~0.75 (x=2), peaks at ~0.8 (x=3), drops sharply to ~0.55 (x=4), rises to ~0.75 (x=5), and stabilizes at ~0.7 (x=6).
#### Right Panel: Length of Subsequence
- **NeurRL(N)** (blue):
- Begins at ~0.9 (x=2), dips to ~0.75 (x=3), fluctuates to ~0.8 (x=4), rises to ~0.85 (x=5), dips to ~0.75 (x=6), rises to ~0.9 (x=7), and stabilizes at ~0.8 (x=8).
- **NeurRL(R)** (orange):
- Starts at ~0.95 (x=2), drops sharply to ~0.55 (x=3), rises to ~0.6 (x=4), fluctuates to ~0.7 (x=5), dips to ~0.65 (x=6), rises to ~0.9 (x=7), and stabilizes at ~0.8 (x=8).
---
### Key Observations
1. **NeurRL(N)** (blue) generally shows higher performance scores across most parameters but exhibits sharper dips (e.g., at x=3 in all panels).
2. **NeurRL(R)** (orange) demonstrates more stability in the **Number of Clusters** and **Length of Subsequence** panels but suffers a significant dip at x=4 in the **Length of Regions** panel.
3. Both algorithms show similar performance trends in the **Length of Subsequence** panel, with NeurRL(R) starting higher but converging with NeurRL(N) at x=8.
---
### Interpretation
The data suggests that **NeurRL(N)** and **NeurRL(R)** respond differently to parameter changes:
- **NeurRL(N)** may prioritize adaptability, excelling in scenarios with fewer clusters or shorter subsequences but struggling with mid-range values (e.g., x=3 in all panels).
- **NeurRL(R)** appears more robust in handling larger subsequences (x=7–8) but is sensitive to mid-range region lengths (x=4).
- The dips in performance (e.g., x=3, x=4) could indicate overfitting, computational constraints, or parameter mismatches. Further investigation into the algorithms' architectures or training data might clarify these trends.