# Technical Document Extraction: Perplexity Analysis Charts
## Chart 1: Perplexity vs Update Frequency (Left Chart)
### Axis Labels
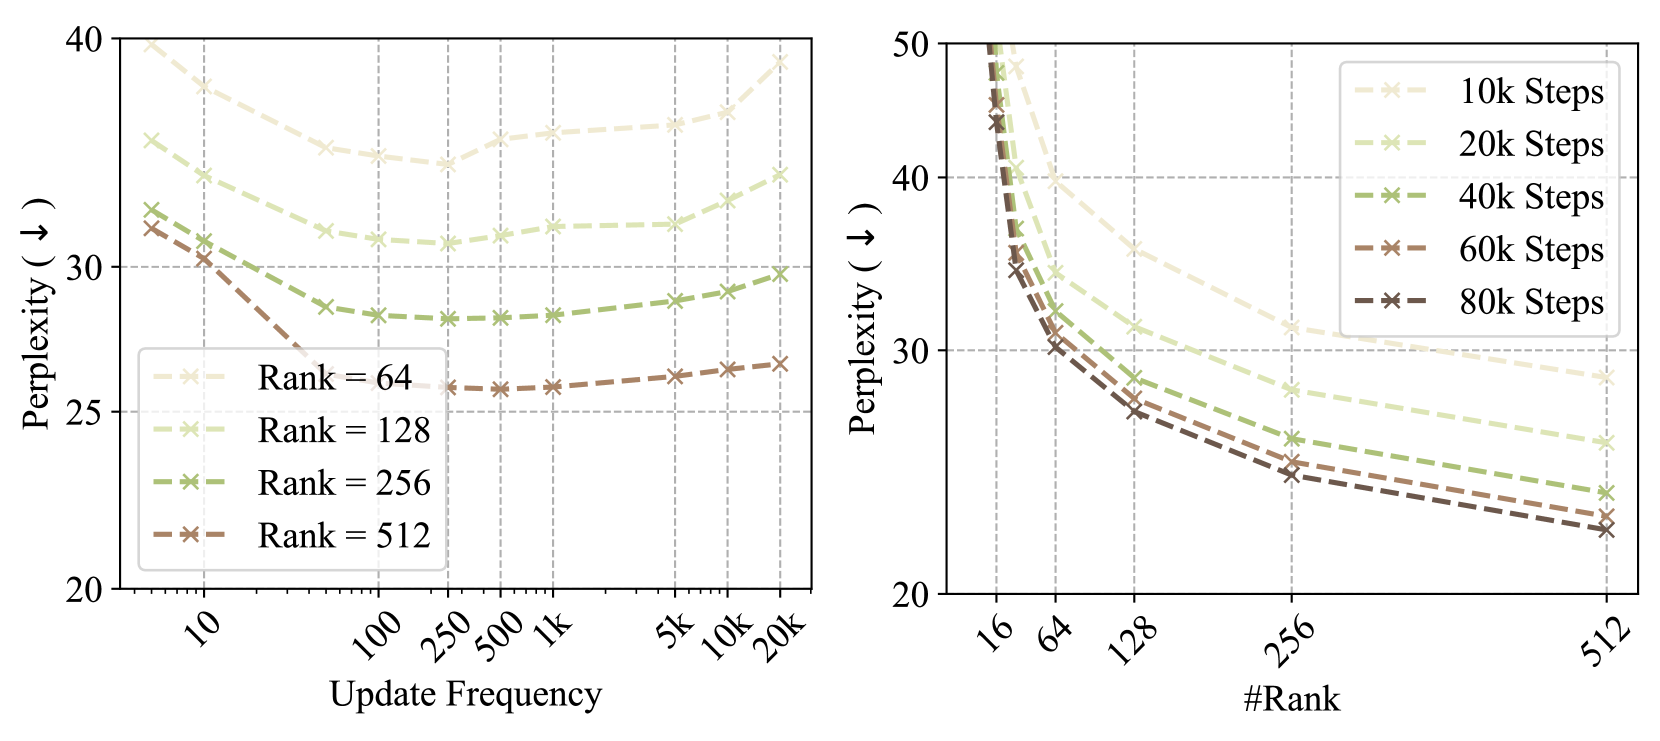
- **X-axis**: Update Frequency (logarithmic scale: 10, 100, 1k, 5k, 10k, 20k)
- **Y-axis**: Perplexity (↓) (linear scale: 20–40)
### Legend
- **Location**: Bottom-left corner
- **Labels**:
- Rank = 64 (light beige, dashed line with `x` markers)
- Rank = 128 (light green, dashed line with `x` markers)
- Rank = 256 (medium green, dashed line with `x` markers)
- Rank = 512 (dark green, dashed line with `x` markers)
### Key Trends
1. **Rank = 64**:
- Starts at ~38 perplexity at 10 updates.
- Sharp decline to ~26 at 100 updates.
- Gradual increase to ~38 at 20k updates.
2. **Rank = 128**:
- Starts at ~34 at 10 updates.
- Declines to ~28 at 100 updates.
- Slight increase to ~32 at 20k updates.
3. **Rank = 256**:
- Starts at ~30 at 10 updates.
- Declines to ~27 at 100 updates.
- Slight increase to ~29 at 20k updates.
4. **Rank = 512**:
- Starts at ~28 at 10 updates.
- Declines to ~25 at 100 updates.
- Slight increase to ~27 at 20k updates.
### Spatial Grounding
- Legend positioned at [x=0, y=0] (bottom-left).
- All lines originate from the leftmost x-axis value (10 updates).
---
## Chart 2: Perplexity vs #Rank (Right Chart)
### Axis Labels
- **X-axis**: #Rank (logarithmic scale: 16, 64, 128, 256, 512)
- **Y-axis**: Perplexity (↓) (linear scale: 20–50)
### Legend
- **Location**: Top-right corner
- **Labels**:
- 10k Steps (light beige, dashed line with `x` markers)
- 20k Steps (light green, dashed line with `x` markers)
- 40k Steps (medium green, dashed line with `x` markers)
- 60k Steps (dark green, dashed line with `x` markers)
- 80k Steps (brown, dashed line with `x` markers)
### Key Trends
1. **10k Steps**:
- Starts at ~48 at #Rank = 16.
- Declines to ~26 at #Rank = 512.
2. **20k Steps**:
- Starts at ~46 at #Rank = 16.
- Declines to ~24 at #Rank = 512.
3. **40k Steps**:
- Starts at ~44 at #Rank = 16.
- Declines to ~22 at #Rank = 512.
4. **60k Steps**:
- Starts at ~42 at #Rank = 16.
- Declines to ~20 at #Rank = 512.
5. **80k Steps**:
- Starts at ~40 at #Rank = 16.
- Declines to ~18 at #Rank = 512.
### Spatial Grounding
- Legend positioned at [x=1, y=1] (top-right).
- All lines originate from the leftmost x-axis value (#Rank = 16).
---
## Cross-Chart Observations
1. **Inverse Relationship**:
- Higher update frequencies (Chart 1) correlate with lower perplexity at specific ranks.
- Higher training steps (Chart 2) correlate with lower perplexity across ranks.
2. **Convergence**:
- Lines in Chart 2 converge as #Rank increases, indicating diminishing returns with larger ranks.
3. **Consistency**:
- Both charts use dashed lines with `x` markers for data points.
- Color coding aligns with legend labels (e.g., light beige = 10k Steps in Chart 2).
## Data Validation
- **Chart 1**: Rank 64 line peaks at 10 updates (~38) and troughs at 100 updates (~26), matching the legend's light beige color.
- **Chart 2**: 10k Steps line starts at ~48 at #Rank = 16, consistent with the legend's light beige color.