## Line Chart: Mean Error over Time
### Overview
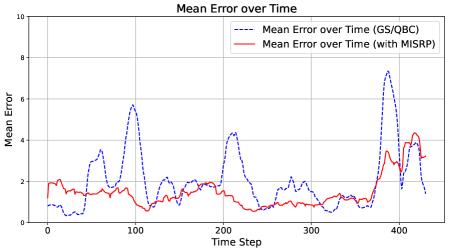
The image is a line chart comparing the mean error over time for two different methods: "GS/QBC" and "with MISRP". The x-axis represents the time step, and the y-axis represents the mean error. The chart displays the fluctuations in mean error for each method across time.
### Components/Axes
* **Title:** Mean Error over Time
* **X-axis:**
* Label: Time Step
* Scale: 0 to 400, with visible markers at 0, 100, 200, 300, and 400.
* **Y-axis:**
* Label: Mean Error
* Scale: 0 to 10, with visible markers at 0, 2, 4, 6, 8, and 10.
* **Legend:** Located in the top-right corner of the chart.
* "Mean Error over Time (GS/QBC)": Represented by a dashed blue line.
* "Mean Error over Time (with MISRP)": Represented by a solid red line.
### Detailed Analysis
* **Mean Error over Time (GS/QBC) - Dashed Blue Line:**
* Trend: Highly variable, with several peaks and troughs.
* Initial Value (Time Step 0): Approximately 0.8
* Peak 1 (Around Time Step 100): Approximately 5.7
* Value at Time Step 200: Approximately 2.2
* Value at Time Step 300: Approximately 1.0
* Peak 2 (Around Time Step 380): Approximately 7.2
* Final Value (Time Step 400): Approximately 1.8
* **Mean Error over Time (with MISRP) - Solid Red Line:**
* Trend: Relatively stable compared to GS/QBC, with fewer large fluctuations.
* Initial Value (Time Step 0): Approximately 1.8
* Value at Time Step 100: Approximately 1.4
* Value at Time Step 200: Approximately 1.8
* Value at Time Step 300: Approximately 0.9
* Peak (Around Time Step 390): Approximately 4.4
* Final Value (Time Step 400): Approximately 3.8
### Key Observations
* The GS/QBC method (dashed blue line) exhibits significantly more volatility in mean error compared to the MISRP method (solid red line).
* The GS/QBC method has higher peak error values, particularly around time steps 100 and 380.
* The MISRP method generally maintains a lower and more consistent mean error, except for a peak near time step 390.
* Both methods show a general decrease in mean error between time steps 200 and 300.
### Interpretation
The chart suggests that the MISRP method is more stable and reliable in terms of mean error over time compared to the GS/QBC method. The GS/QBC method, while potentially achieving lower error values at certain points, is prone to larger and more frequent fluctuations. This could indicate that the MISRP method is more robust to changes in the environment or input data. The peak in MISRP error near time step 390 warrants further investigation to understand the cause of this temporary instability. The data implies that for applications where consistent performance is critical, the MISRP method may be preferable.