## Comparative Analysis of Statistical Power and Type I Error Rates
### Overview
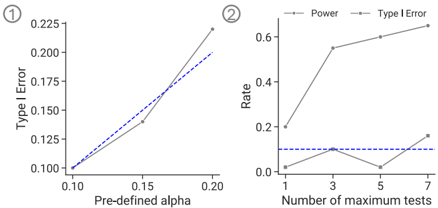
The image contains two distinct line charts, labeled ① and ②, presented side-by-side. Both charts analyze the relationship between statistical parameters and error rates. A single, shared legend is positioned centrally between the two charts, applying to both. The charts use a consistent color scheme: a solid gray line for "Type I Error" and a blue dashed line for "Power."
### Components/Axes
**Shared Legend:**
* **Position:** Centered horizontally between the two charts, vertically aligned with the top of the y-axes.
* **Labels:**
* `-- Power` (Blue dashed line)
* `— Type I Error` (Solid gray line)
**Chart ① (Left):**
* **Title/Label:** ① (circled number in top-left corner)
* **X-axis:** Label: `Pre-defined alpha`. Scale: Linear, from 0.10 to 0.20. Ticks at 0.10, 0.15, 0.20.
* **Y-axis:** Label: `Type I Error`. Scale: Linear, from 0.100 to 0.225. Ticks at 0.100, 0.125, 0.150, 0.175, 0.200, 0.225.
**Chart ② (Right):**
* **Title/Label:** ② (circled number in top-left corner)
* **X-axis:** Label: `Number of maximum tests`. Scale: Discrete/Categorical. Ticks at 1, 3, 5, 7.
* **Y-axis:** Label: `Rate`. Scale: Linear, from 0 to 0.6. Ticks at 0, 0.2, 0.4, 0.6.
* **Additional Element:** A horizontal blue dashed line at y = 0.1, extending across the chart's width. This appears to be a reference line, possibly indicating a target or nominal power level.
### Detailed Analysis
**Chart ①: Type I Error and Power vs. Pre-defined Alpha**
* **Trend Verification:**
* **Type I Error (Gray Line):** Slopes upward. The increase is moderate from alpha=0.10 to 0.15, then becomes steeper from 0.15 to 0.20.
* **Power (Blue Dashed Line):** Slopes upward at a relatively constant, moderate rate.
* **Data Points (Approximate):**
* At `Pre-defined alpha = 0.10`: Type I Error ≈ 0.100; Power ≈ 0.100.
* At `Pre-defined alpha = 0.15`: Type I Error ≈ 0.140; Power ≈ 0.150.
* At `Pre-defined alpha = 0.20`: Type I Error ≈ 0.225; Power ≈ 0.200.
**Chart ②: Type I Error and Power vs. Number of Maximum Tests**
* **Trend Verification:**
* **Type I Error (Gray Line):** Slopes sharply upward from 1 to 3 tests, then continues to increase at a slower rate from 3 to 7 tests.
* **Power (Blue Dashed Line):** Shows a non-monotonic trend. It increases from 1 to 3 tests, decreases sharply at 5 tests, then increases again at 7 tests.
* **Data Points (Approximate):**
* At `Number of maximum tests = 1`: Type I Error ≈ 0.20; Power ≈ 0.02.
* At `Number of maximum tests = 3`: Type I Error ≈ 0.55; Power ≈ 0.10 (aligns with the horizontal reference line).
* At `Number of maximum tests = 5`: Type I Error ≈ 0.60; Power ≈ 0.02.
* At `Number of maximum tests = 7`: Type I Error ≈ 0.65; Power ≈ 0.18.
### Key Observations
1. **Divergent Impact of Alpha (Chart ①):** While both error rates increase with a higher pre-defined alpha, the Type I Error rate accelerates more dramatically beyond alpha=0.15, surpassing the Power rate.
2. **Severe Inflation with Multiple Tests (Chart ②):** The Type I Error rate inflates severely as the number of maximum tests increases, reaching approximately 0.65 with 7 tests. This is a classic illustration of the multiple comparisons problem.
3. **Volatile Power (Chart ②):** Power does not improve reliably with more tests in this scenario. It peaks at 3 tests (matching the 0.1 reference line), collapses at 5 tests, and recovers partially at 7 tests. This suggests a complex, potentially non-linear relationship or a specific experimental design constraint.
4. **Reference Line Significance:** The horizontal line at Rate=0.1 in Chart ② serves as a benchmark. Power only meets this benchmark at 3 tests and falls below it at 1 and 5 tests.
### Interpretation
These charts collectively demonstrate critical trade-offs in statistical hypothesis testing, likely in the context of sequential or multiple testing procedures.
* **Chart ①** shows that relaxing the significance threshold (increasing alpha) boosts statistical power but at the cost of a more than proportional increase in the false positive rate (Type I Error). The crossing point (around alpha=0.17) indicates where the risk of a false positive begins to exceed the probability of detecting a true effect.
* **Chart ②** provides a stark warning about conducting multiple tests. The Type I Error rate balloons uncontrollably, making any single "significant" finding highly suspect without correction. The erratic behavior of the Power line is particularly noteworthy; it implies that simply increasing the number of tests does not guarantee a higher chance of detecting a true effect and may, in some designs, even reduce it temporarily. This could be due to factors like alpha spending, conditional power, or the specific structure of the testing sequence.
**Underlying Message:** The data argues for careful pre-specification of alpha and a strong justification for any multiple testing procedure. It highlights that naive increases in either the alpha level or the number of tests can lead to unacceptably high false positive rates, undermining the reliability of statistical conclusions. The non-monotonic power curve in Chart ② suggests that the relationship between testing effort and sensitivity is not straightforward and requires sophisticated methods to optimize.