## Heatmap: Relationship between Pre-defined Alpha and Type I Error Rate
### Overview
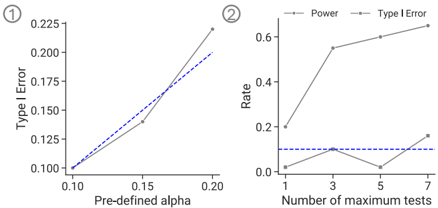
The heatmap illustrates the relationship between the pre-defined alpha level and the Type I error rate in statistical hypothesis testing. The x-axis represents the pre-defined alpha levels, ranging from 0.10 to 0.20, while the y-axis shows the Type I error rate, ranging from 0.00 to 0.60. The color intensity indicates the magnitude of the error rate.
### Components/Axes
- **Pre-defined Alpha (x-axis)**: Ranges from 0.10 to 0.20.
- **Type I Error Rate (y-axis)**: Ranges from 0.00 to 0.60.
- **Color Intensity**: Indicates the magnitude of the Type I error rate, with darker shades representing higher error rates.
### Detailed Analysis or ### Content Details
The heatmap shows a clear trend where the Type I error rate increases as the pre-defined alpha level increases. This is evident from the diagonal line that runs from the bottom-left to the top-right of the heatmap. The line is represented by a dashed blue line, which serves as a reference to the expected Type I error rate for a given pre-defined alpha level.
### Key Observations
- **Trend**: The Type I error rate increases with the pre-defined alpha level.
- **Reference Line**: The dashed blue line represents the expected Type I error rate for a given pre-defined alpha level.
- **Color Gradient**: The color gradient indicates the magnitude of the Type I error rate, with darker shades representing higher error rates.
### Interpretation
The heatmap suggests that as the pre-defined alpha level increases, the likelihood of making a Type I error also increases. This is because a higher alpha level means a higher threshold for rejecting the null hypothesis, which increases the probability of incorrectly rejecting a true null hypothesis. The reference line provides a benchmark to compare the actual Type I error rate against the expected rate for a given pre-defined alpha level. The color gradient helps in visualizing the magnitude of the error rate, with darker shades indicating higher error rates.