Here is a detailed technical description of the bar chart:
### Chart Description
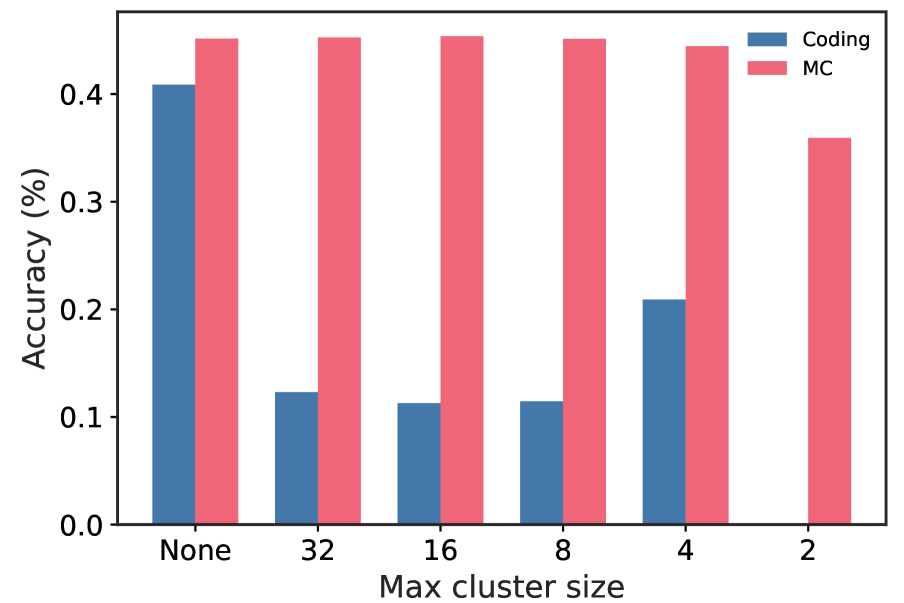
This is a grouped bar chart comparing the "Accuracy (%)" of two categories, "Coding" and "MC", across different "Max cluster size" settings.
### Axes and Legend
* **Y-axis:** The vertical axis is titled "Accuracy (%)" and has markers at 0.0, 0.1, 0.2, 0.3, and 0.4.
* **X-axis:** The horizontal axis is titled "Max cluster size" and features six categorical labels: "None", "32", "16", "8", "4", and "2".
* **Legend:** Located in the top right corner [0.8, 0.9], the legend indicates that blue bars represent "Coding" and red bars represent "MC".
### Data Points
The chart displays the following approximate accuracy values for each "Max cluster size":
| Max cluster size | Coding (Blue) | MC (Red) |
| :--- | :--- | :--- |
| **None** | ~0.41 | ~0.45 |
| **32** | ~0.12 | ~0.45 |
| **16** | ~0.11 | ~0.45 |
| **8** | ~0.11 | ~0.45 |
| **4** | ~0.21 | ~0.44 |
| **2** | 0.0 (No bar) | ~0.36 |
### Trends
* **Coding:** The accuracy for "Coding" is highest when the "Max cluster size" is "None" (~0.41). It drops significantly to around 0.11-0.12 for cluster sizes of 32, 16, and 8. There is a slight increase to ~0.21 at a cluster size of 4, and no data is presented for a cluster size of 2.
* **MC:** The accuracy for "MC" remains relatively stable and high, around 0.44-0.45, for "Max cluster size" settings from "None" down to 4. It shows a noticeable decrease to approximately 0.36 at a cluster size of 2.
* **Comparison:** For all "Max cluster size" settings where both data points are present, the "MC" accuracy is consistently higher than the "Coding" accuracy.