## Line Graphs: AlphaEvolve Bound vs. Cohn-Elkies Benchmark
### Overview
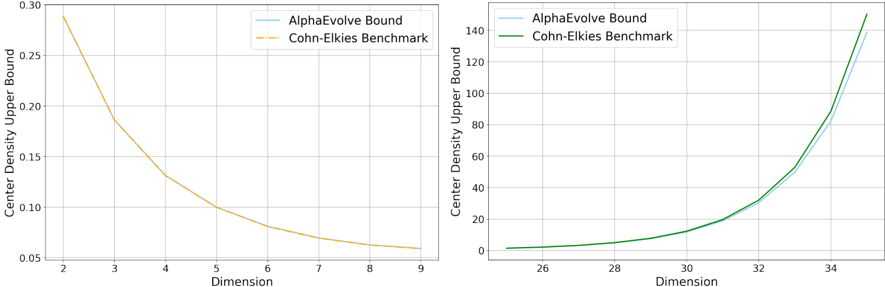
The image contains two line graphs comparing the AlphaEvolve Bound and Cohn-Elkies Benchmark. The left graph shows the relationship between "Center Density Upper Bound" and "Dimension" for dimensions 2 to 9. The right graph shows the same relationship but for dimensions 25 to 35.
### Components/Axes
**Left Graph:**
* **X-axis:** Dimension, with markers at 2, 3, 4, 5, 6, 7, 8, and 9.
* **Y-axis:** Center Density Upper Bound, with markers at 0.05, 0.10, 0.15, 0.20, 0.25, and 0.30.
* **Legend (Top-Right):**
* AlphaEvolve Bound (Light Blue, solid line)
* Cohn-Elkies Benchmark (Yellow, dashed line)
**Right Graph:**
* **X-axis:** Dimension, with markers at 26, 28, 30, 32, and 34.
* **Y-axis:** Center Density Upper Bound, with markers at 0, 20, 40, 60, 80, 100, 120, and 140.
* **Legend (Top-Left):**
* AlphaEvolve Bound (Light Blue, solid line)
* Cohn-Elkies Benchmark (Green, solid line)
### Detailed Analysis
**Left Graph:**
* **AlphaEvolve Bound:** The light blue line is not visible on the left graph, suggesting it is very close to the Cohn-Elkies Benchmark.
* **Cohn-Elkies Benchmark:** The yellow dashed line shows a decreasing trend.
* Dimension 2: Center Density Upper Bound is approximately 0.28.
* Dimension 3: Center Density Upper Bound is approximately 0.18.
* Dimension 4: Center Density Upper Bound is approximately 0.13.
* Dimension 5: Center Density Upper Bound is approximately 0.10.
* Dimension 6: Center Density Upper Bound is approximately 0.08.
* Dimension 7: Center Density Upper Bound is approximately 0.07.
* Dimension 8: Center Density Upper Bound is approximately 0.06.
* Dimension 9: Center Density Upper Bound is approximately 0.06.
**Right Graph:**
* **AlphaEvolve Bound:** The light blue line shows an increasing trend.
* Dimension 26: Center Density Upper Bound is approximately 2.
* Dimension 28: Center Density Upper Bound is approximately 4.
* Dimension 30: Center Density Upper Bound is approximately 10.
* Dimension 32: Center Density Upper Bound is approximately 30.
* Dimension 34: Center Density Upper Bound is approximately 100.
* Dimension 35: Center Density Upper Bound is approximately 140.
* **Cohn-Elkies Benchmark:** The green line shows an increasing trend, closely following the AlphaEvolve Bound.
* Dimension 26: Center Density Upper Bound is approximately 2.
* Dimension 28: Center Density Upper Bound is approximately 5.
* Dimension 30: Center Density Upper Bound is approximately 12.
* Dimension 32: Center Density Upper Bound is approximately 32.
* Dimension 34: Center Density Upper Bound is approximately 90.
* Dimension 35: Center Density Upper Bound is approximately 130.
### Key Observations
* In the left graph, the Cohn-Elkies Benchmark decreases as the dimension increases.
* In the right graph, both AlphaEvolve Bound and Cohn-Elkies Benchmark increase as the dimension increases.
* The AlphaEvolve Bound and Cohn-Elkies Benchmark are very close in value in both graphs, especially in the right graph.
### Interpretation
The graphs compare the Center Density Upper Bound calculated by two different methods (AlphaEvolve Bound and Cohn-Elkies Benchmark) across different dimensions. The left graph shows that for lower dimensions (2-9), the Cohn-Elkies Benchmark decreases as the dimension increases. The right graph shows that for higher dimensions (25-35), both methods increase as the dimension increases. The close proximity of the lines suggests that the two methods produce similar results, especially at higher dimensions. The decreasing trend in the left graph and the increasing trend in the right graph indicate a change in the relationship between dimension and center density upper bound as the dimension increases.