## Chart: Center Density Upper Bound vs. Dimension
### Overview
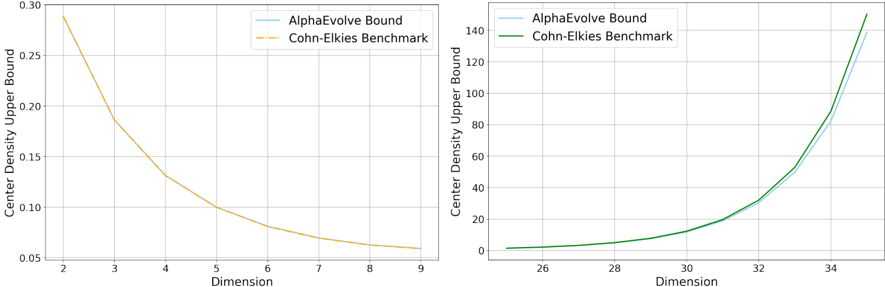
The image presents two line charts displaying the relationship between "Dimension" and "Center Density Upper Bound" for two different benchmarks: "AlphaEvolve Bound" and "Cohn-Elkies Benchmark". The charts are presented side-by-side, each focusing on a different range of dimensions.
### Components/Axes
* **X-axis (Left Chart):** Dimension, ranging from approximately 2 to 9.
* **Y-axis (Left Chart):** Center Density Upper Bound, ranging from approximately 0.05 to 0.30.
* **X-axis (Right Chart):** Dimension, ranging from approximately 26 to 34.
* **Y-axis (Right Chart):** Center Density Upper Bound, ranging from approximately 0 to 140.
* **Legend (Top-Left):**
* AlphaEvolve Bound (Blue Line)
* Cohn-Elkies Benchmark (Orange/Yellow Line)
* **Legend (Top-Right):**
* AlphaEvolve Bound (Green Line)
* Cohn-Elkies Benchmark (Black Line)
### Detailed Analysis or Content Details
**Left Chart (Dimensions 2-9):**
* **Cohn-Elkies Benchmark (Orange Line):** The line slopes downward from approximately 0.27 at Dimension 2 to approximately 0.07 at Dimension 9.
* Dimension 2: ~0.27
* Dimension 3: ~0.20
* Dimension 4: ~0.15
* Dimension 5: ~0.12
* Dimension 6: ~0.10
* Dimension 7: ~0.085
* Dimension 8: ~0.075
* Dimension 9: ~0.07
* **AlphaEvolve Bound (Blue Line):** This line is not visible in this range of dimensions.
**Right Chart (Dimensions 26-34):**
* **AlphaEvolve Bound (Green Line):** The line slopes upward from approximately 10 at Dimension 26 to approximately 120 at Dimension 34.
* Dimension 26: ~10
* Dimension 28: ~15
* Dimension 30: ~20
* Dimension 32: ~60
* Dimension 34: ~120
* **Cohn-Elkies Benchmark (Black Line):** The line is relatively flat, remaining close to 0 for most of the range, then rises sharply at Dimension 34 to approximately 10.
* Dimension 26: ~0
* Dimension 28: ~0
* Dimension 30: ~0
* Dimension 32: ~0
* Dimension 34: ~10
### Key Observations
* The Cohn-Elkies Benchmark exhibits a decreasing trend in the Center Density Upper Bound as the dimension increases from 2 to 9.
* The AlphaEvolve Bound is not visible in the left chart (dimensions 2-9).
* The AlphaEvolve Bound exhibits a rapidly increasing trend in the Center Density Upper Bound as the dimension increases from 26 to 34.
* The Cohn-Elkies Benchmark remains very low until Dimension 34, where it experiences a sharp increase.
### Interpretation
The charts compare the performance of two benchmarks, AlphaEvolve and Cohn-Elkies, in terms of the Center Density Upper Bound across different dimensions. The left chart suggests that the Cohn-Elkies Benchmark performs better (lower upper bound) in lower dimensions (2-9). However, the right chart reveals a significant divergence in higher dimensions (26-34). The AlphaEvolve Bound shows a dramatic increase in the upper bound as the dimension increases, while the Cohn-Elkies Benchmark remains low until a sudden jump at Dimension 34.
This suggests that the AlphaEvolve method may become less effective or more computationally expensive in higher dimensions, leading to a larger upper bound on the center density. The Cohn-Elkies Benchmark appears to maintain a relatively stable performance until a certain dimension, after which its upper bound also increases. The sharp increase in the Cohn-Elkies Benchmark at Dimension 34 could indicate a phase transition or a limitation of the method at that specific dimension. The two charts, when considered together, highlight the differing scalability characteristics of the two benchmarks.