## Line Charts: Center Density Upper Bound vs. Dimension
### Overview
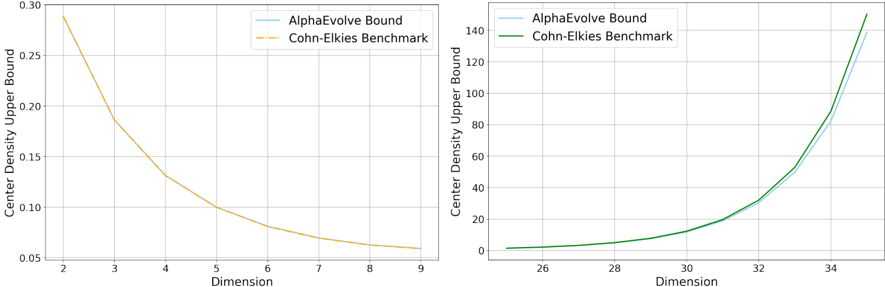
The image contains two side-by-side line charts comparing the "Center Density Upper Bound" as a function of "Dimension" for two different methods: "AlphaEvolve Bound" and "Cohn-Elkies Benchmark." The charts cover two distinct, non-overlapping ranges of the dimension axis, suggesting they illustrate behavior in different regimes (low vs. high dimensionality).
### Components/Axes
**Common Elements:**
* **Chart Type:** Two separate line charts, arranged horizontally.
* **X-Axis Label (Both Charts):** "Dimension"
* **Y-Axis Label (Both Charts):** "Center Density Upper Bound"
* **Legends (Both Charts):** Located in the top-right corner of each chart's plot area.
* **Left Chart Legend:**
* Cyan solid line: "AlphaEvolve Bound"
* Orange dashed line: "Cohn-Elkies Benchmark"
* **Right Chart Legend:**
* Cyan solid line: "AlphaEvolve Bound"
* Green solid line: "Cohn-Elkies Benchmark"
**Left Chart Specifics:**
* **X-Axis Range:** 2 to 9 (linear scale, integer markers).
* **Y-Axis Range:** Approximately 0.05 to 0.30 (linear scale, markers at 0.05 intervals).
* **Grid:** Light gray grid lines are present.
**Right Chart Specifics:**
* **X-Axis Range:** Approximately 25 to 35 (linear scale, markers at 26, 28, 30, 32, 34).
* **Y-Axis Range:** 0 to 140 (linear scale, markers at 20-unit intervals).
* **Grid:** Light gray grid lines are present.
### Detailed Analysis
**Left Chart (Dimensions 2-9):**
* **Trend Verification:** Both lines show a clear, smooth, decreasing (decaying) trend as dimension increases. The slope is steepest at low dimensions and flattens out.
* **Data Series & Points (Approximate):**
* **AlphaEvolve Bound (Cyan) & Cohn-Elkies Benchmark (Orange):** The two lines are nearly indistinguishable, overlapping almost perfectly across the entire range.
* At Dimension 2: Value ≈ 0.29.
* At Dimension 3: Value ≈ 0.19.
* At Dimension 5: Value ≈ 0.10.
* At Dimension 9: Value ≈ 0.06.
* **Relationship:** The benchmark and the bound are in extremely close agreement for low dimensions.
**Right Chart (Dimensions ~25-35):**
* **Trend Verification:** Both lines show a clear, smooth, increasing (exponential-like) trend as dimension increases. The slope becomes progressively steeper.
* **Data Series & Points (Approximate):**
* **AlphaEvolve Bound (Cyan):** Starts near 0 at dimension 25, rises to ≈10 at dimension 30, ≈40 at dimension 32, and ≈120 at dimension 35.
* **Cohn-Elkies Benchmark (Green):** Follows a very similar path but begins to diverge slightly upward from the AlphaEvolve Bound at higher dimensions. At dimension 35, it reaches ≈140, which is visibly higher than the cyan line.
* **Relationship:** The two methods remain closely aligned until approximately dimension 32, after which the Cohn-Elkies Benchmark shows a slightly higher upper bound than the AlphaEvolve Bound.
### Key Observations
1. **Regime Dependence:** The behavior of the center density upper bound is fundamentally different in low vs. high dimensions. It decreases in the low-dimensional regime (2-9) and increases rapidly in the high-dimensional regime (25-35).
2. **Benchmark Agreement:** The "AlphaEvolve Bound" and the "Cohn-Elkies Benchmark" are in near-perfect agreement for dimensions 2 through 9.
3. **High-Dimensional Divergence:** A small but consistent divergence appears in the high-dimensional chart, with the Cohn-Elkies Benchmark yielding a slightly higher (worse) upper bound than the AlphaEvolve Bound for dimensions greater than ~32.
4. **Scale Difference:** The y-axis scale on the right chart (0-140) is orders of magnitude larger than on the left chart (0.05-0.30), highlighting the dramatic growth in the bound at high dimensions.
### Interpretation
This visualization presents a comparative analysis of a theoretical bound ("AlphaEvolve") against an established benchmark ("Cohn-Elkies") in the context of sphere packing or coding theory, where "center density" is a key metric.
* **What the data suggests:** The near-perfect overlap in the left chart validates the AlphaEvolve method against the benchmark in the low-dimensional regime. The right chart demonstrates that both methods predict a rapid, likely exponential, increase in the upper bound of center density as dimension grows very large, which is a known phenomenon in high-dimensional geometry.
* **How elements relate:** The two charts are complementary, showing two sides of the same relationship. The left establishes accuracy in a well-understood range, while the right explores asymptotic behavior. The slight divergence at the highest dimensions (32+) could indicate a minor advantage for the AlphaEvolve method or simply numerical/visual limits of the plot.
* **Notable anomalies:** The most striking feature is the reversal of the trend direction between the two dimension regimes. This is not an anomaly but a fundamental characteristic being illustrated: the property being bounded behaves oppositely in low versus very high dimensions. The clean, smooth curves suggest these are theoretical or computed bounds, not noisy experimental data.