## Line Graphs: Center Density Upper Bound vs. Dimension
### Overview
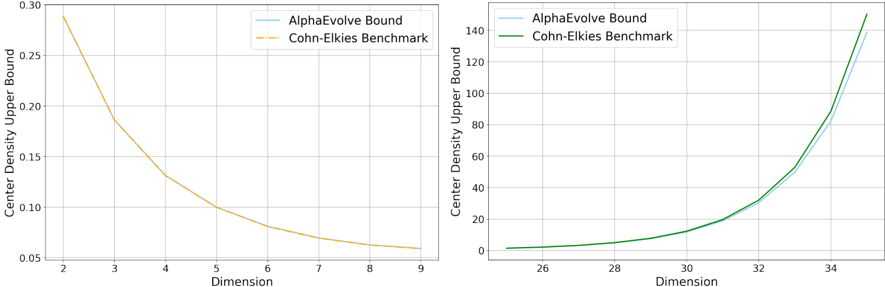
The image contains two line graphs comparing the "Center Density Upper Bound" across different dimensions for two methods: **AlphaEvolve Bound** and **Cohn-Elkies Benchmark**. The left graph focuses on lower dimensions (2–9), while the right graph examines higher dimensions (26–34). Both graphs highlight inverse trends for the Cohn-Elkies Benchmark and similar upward trends for the AlphaEvolve Bound.
---
### Components/Axes
1. **Left Graph**:
- **X-axis**: "Dimension" (integer values 2–9).
- **Y-axis**: "Center Density Upper Bound" (range: 0.05–0.30).
- **Legend**:
- **Dashed Orange Line**: Cohn-Elkies Benchmark.
- **Solid Blue Line**: AlphaEvolve Bound (not visible in this graph).
- **Placement**: Legend in the top-right corner.
2. **Right Graph**:
- **X-axis**: "Dimension" (integer values 26–34).
- **Y-axis**: "Center Density Upper Bound" (range: 0–140).
- **Legend**:
- **Dashed Green Line**: Cohn-Elkies Benchmark.
- **Solid Blue Line**: AlphaEvolve Bound.
- **Placement**: Legend in the top-right corner.
---
### Detailed Analysis
#### Left Graph (Dimensions 2–9)
- **Cohn-Elkies Benchmark**:
- Starts at ~0.28 (dimension 2) and decreases exponentially.
- Ends at ~0.06 (dimension 9).
- **Trend**: Steady decline with increasing dimension.
- **AlphaEvolve Bound**:
- No visible data points; likely below the y-axis range (0.05–0.30).
#### Right Graph (Dimensions 26–34)
- **Cohn-Elkies Benchmark**:
- Starts near 0 (dimension 26) and rises sharply.
- Ends at ~140 (dimension 34).
- **Trend**: Exponential growth with increasing dimension.
- **AlphaEvolve Bound**:
- Follows a similar upward trend but remains slightly below the Cohn-Elkies Benchmark.
- Ends at ~135 (dimension 34).
---
### Key Observations
1. **Inverse Relationship in Lower Dimensions**:
- The Cohn-Elkies Benchmark shows a clear decrease in upper bound as dimension increases (left graph).
2. **Exponential Growth in Higher Dimensions**:
- Both methods exhibit rapid growth in the right graph, but the Cohn-Elkies Benchmark consistently outperforms AlphaEvolve.
3. **AlphaEvolve Bound**:
- Invisible in the left graph, suggesting it may not be applicable or performs better at lower dimensions.
- In the right graph, it lags slightly behind the Cohn-Elkies Benchmark.
---
### Interpretation
- **Cohn-Elkies Benchmark**:
- Demonstrates efficiency at lower dimensions (left graph) but becomes less scalable at higher dimensions (right graph), as its upper bound grows exponentially.
- **AlphaEvolve Bound**:
- Appears more stable or efficient at lower dimensions (implied by absence in the left graph) but struggles to maintain a competitive upper bound at higher dimensions compared to Cohn-Elkies.
- **Implications**:
- The Cohn-Elkies Benchmark may be preferable for low-dimensional problems, while AlphaEvolve could be better suited for specific cases where scalability is less critical.
- The exponential growth in the right graph suggests both methods face challenges in high-dimensional spaces, with Cohn-Elkies being more resource-intensive.
---
### Language Note
All text in the image is in English. No non-English content is present.