## Bar Chart: Number of Snapshots vs. Number of Past Actions
### Overview
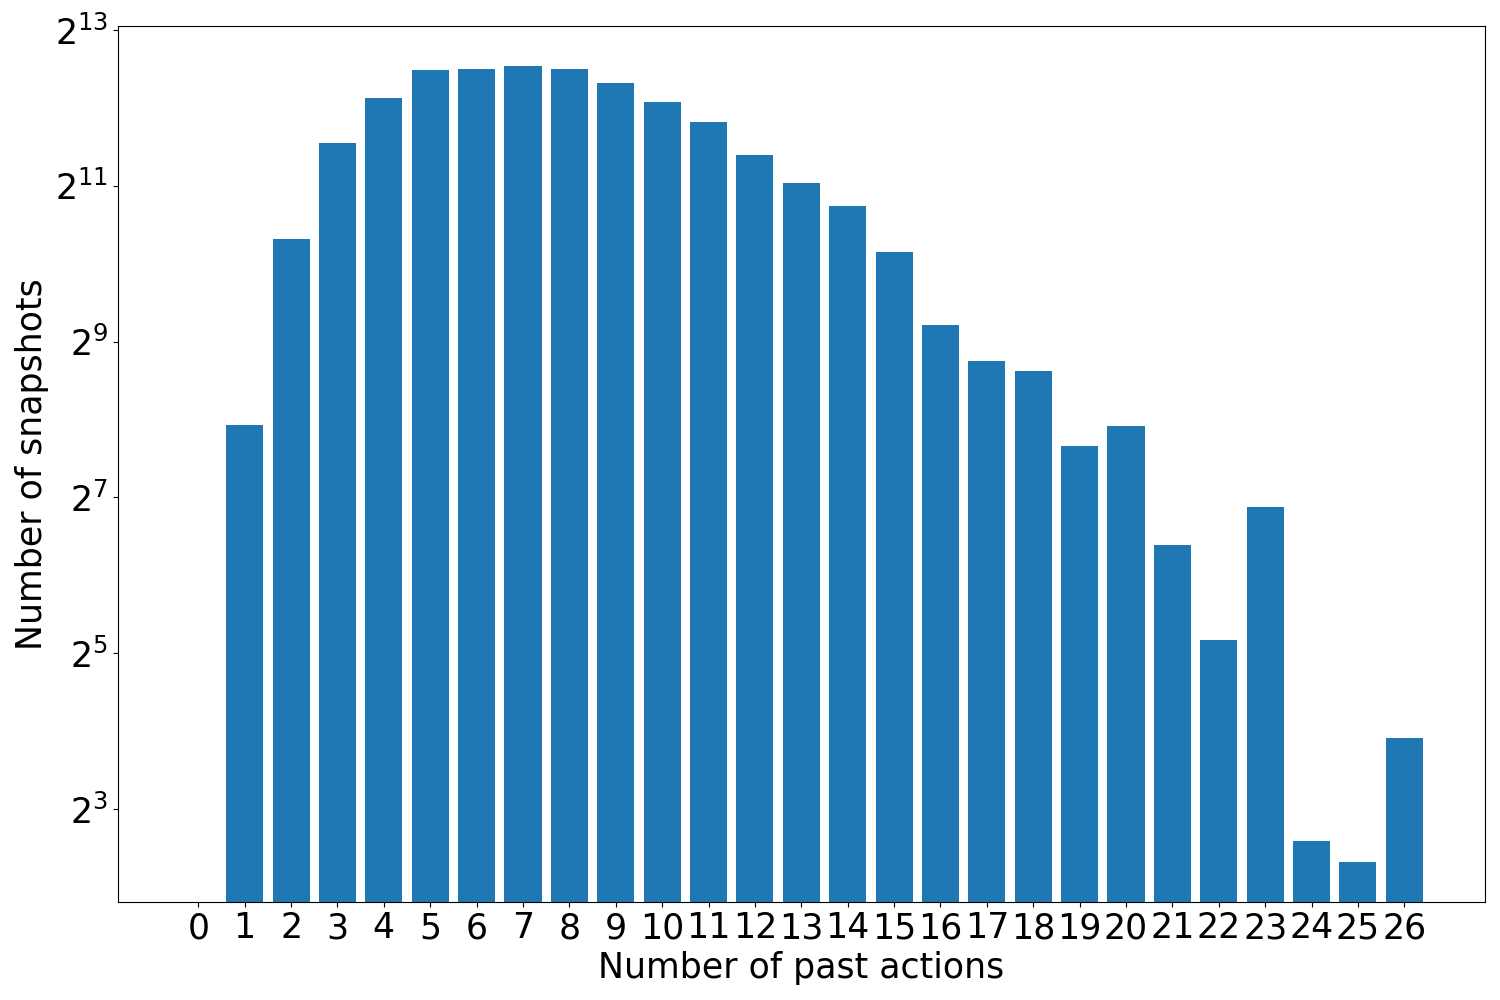
The image presents a bar chart illustrating the relationship between the number of past actions and the number of snapshots taken. The y-axis uses a logarithmic scale. The chart shows a peak in snapshot frequency around 6-9 past actions, with a rapid decline in snapshot frequency as the number of past actions increases beyond 10.
### Components/Axes
* **X-axis Title:** "Number of past actions"
* Axis Markers: 0, 1, 2, 3, 4, 5, 6, 7, 8, 9, 10, 11, 12, 13, 14, 15, 16, 17, 18, 19, 20, 21, 22, 23, 24, 25, 26
* **Y-axis Title:** "Number of snapshots"
* Axis Scale: Logarithmic scale, with values approximately ranging from 2<sup>2</sup> to 2<sup>13</sup>. The scale is not explicitly labeled with numerical values, but the powers of 2 are indicated.
* **Data Series:** A single series of bars representing the number of snapshots for each number of past actions.
* **No Legend:** There is no legend present in the image.
### Detailed Analysis
The chart consists of 27 bars, each representing a specific number of past actions. The height of each bar corresponds to the number of snapshots taken for that number of past actions.
* **0 Past Actions:** Approximately 2<sup>3</sup> snapshots (around 8).
* **1 Past Action:** Approximately 2<sup>5</sup> snapshots (around 32).
* **2 Past Actions:** Approximately 2<sup>7</sup> snapshots (around 128).
* **3 Past Actions:** Approximately 2<sup>9</sup> snapshots (around 512).
* **4 Past Actions:** Approximately 2<sup>10</sup> snapshots (around 1024).
* **5 Past Actions:** Approximately 2<sup>11</sup> snapshots (around 2048).
* **6 Past Actions:** Approximately 2<sup>12</sup> snapshots (around 4096).
* **7 Past Actions:** Approximately 2<sup>12.5</sup> snapshots (around 5700).
* **8 Past Actions:** Approximately 2<sup>12.8</sup> snapshots (around 6800).
* **9 Past Actions:** Approximately 2<sup>13</sup> snapshots (around 8192).
* **10 Past Actions:** Approximately 2<sup>12</sup> snapshots (around 4096).
* **11 Past Actions:** Approximately 2<sup>11.5</sup> snapshots (around 3400).
* **12 Past Actions:** Approximately 2<sup>11</sup> snapshots (around 2048).
* **13 Past Actions:** Approximately 2<sup>10.5</sup> snapshots (around 1700).
* **14 Past Actions:** Approximately 2<sup>10</sup> snapshots (around 1024).
* **15 Past Actions:** Approximately 2<sup>9.5</sup> snapshots (around 850).
* **16 Past Actions:** Approximately 2<sup>9</sup> snapshots (around 512).
* **17 Past Actions:** Approximately 2<sup>8.5</sup> snapshots (around 340).
* **18 Past Actions:** Approximately 2<sup>8</sup> snapshots (around 256).
* **19 Past Actions:** Approximately 2<sup>7.5</sup> snapshots (around 180).
* **20 Past Actions:** Approximately 2<sup>7</sup> snapshots (around 128).
* **21 Past Actions:** Approximately 2<sup>6</sup> snapshots (around 64).
* **22 Past Actions:** Approximately 2<sup>5</sup> snapshots (around 32).
* **23 Past Actions:** Approximately 2<sup>4</sup> snapshots (around 16).
* **24 Past Actions:** Approximately 2<sup>3</sup> snapshots (around 8).
* **25 Past Actions:** Approximately 2<sup>2</sup> snapshots (around 4).
* **26 Past Actions:** Approximately 2<sup>1</sup> snapshots (around 2).
The trend is a rapid increase in the number of snapshots from 0 to 9 past actions, followed by a steep decline from 10 to 26 past actions.
### Key Observations
* The peak snapshot frequency occurs between 6 and 9 past actions.
* The number of snapshots decreases exponentially as the number of past actions increases beyond 9.
* The logarithmic scale on the y-axis emphasizes the relative changes in snapshot frequency.
### Interpretation
The data suggests that the system is most actively recording snapshots when there are a moderate number of recent actions (6-9). This could indicate a period of significant change or activity. As the number of past actions increases, the need for new snapshots diminishes, likely because the system has already captured sufficient information about the current state. The rapid decline in snapshots after 9 past actions suggests a diminishing return on capturing additional snapshots. This could be a deliberate optimization to reduce storage requirements or processing overhead. The initial low snapshot count for 0 and 1 past actions could represent a system initialization phase or a period of inactivity. The data could be related to a reinforcement learning environment, a game recording system, or any application where snapshots are used to track state changes.