## Bar Chart: Distribution of Snapshots by Number of Past Actions
### Overview
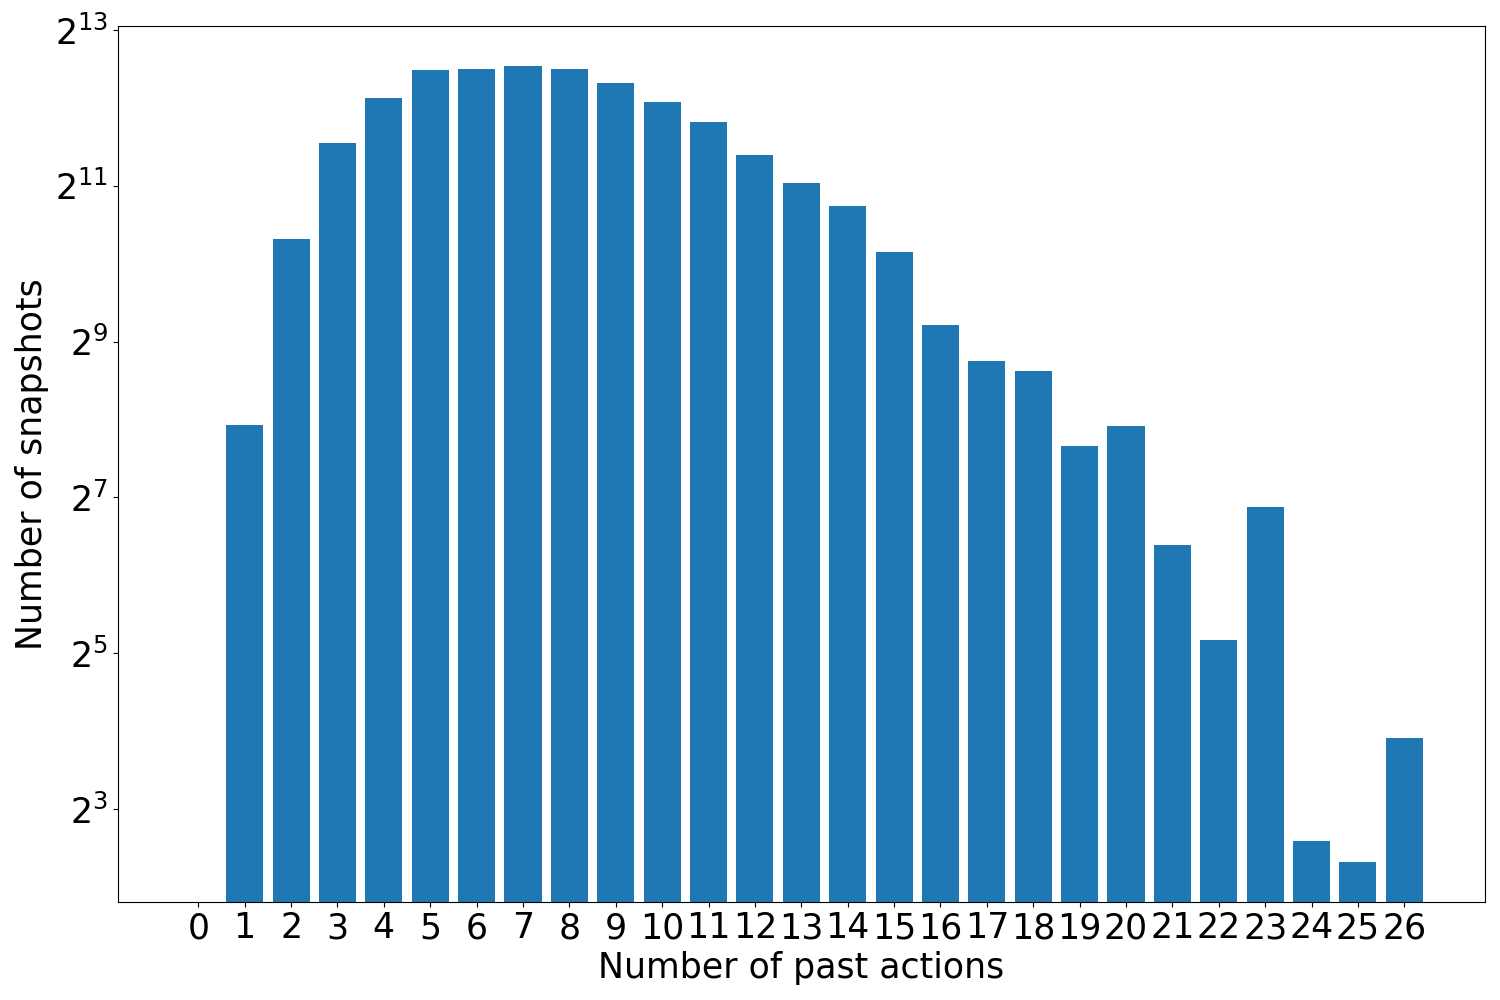
The image displays a vertical bar chart illustrating the frequency distribution of "snapshots" across a range of "Number of past actions." The chart uses a logarithmic scale on the y-axis, indicating that the data spans several orders of magnitude. The overall shape of the distribution is unimodal and right-skewed, with a peak in the lower-middle range of the x-axis.
### Components/Axes
* **Chart Type:** Vertical Bar Chart (Histogram-like).
* **X-Axis:**
* **Label:** "Number of past actions"
* **Scale:** Linear, integer values from 0 to 26.
* **Tick Marks:** Present for every integer from 0 to 26.
* **Y-Axis:**
* **Label:** "Number of snapshots"
* **Scale:** Logarithmic (base 2).
* **Major Tick Marks & Labels:** 2³, 2⁵, 2⁷, 2⁹, 2¹¹, 2¹³.
* **Data Series:** A single series represented by blue bars. There is no legend, as only one category of data is plotted.
* **Spatial Layout:** The chart is contained within a standard rectangular frame with axes on the left and bottom. The bars are evenly spaced along the x-axis.
### Detailed Analysis
The chart shows the count of snapshots (y-axis) for each discrete number of past actions (x-axis). Due to the logarithmic y-axis, the height of each bar represents an approximate power of two.
**Approximate Data Points (y ≈ 2^k):**
* **x=1:** y ≈ 2⁸ (256)
* **x=2:** y ≈ 2¹⁰ (1,024)
* **x=3:** y ≈ 2¹¹·⁵ (~2,896)
* **x=4:** y ≈ 2¹² (4,096)
* **x=5:** y ≈ 2¹²·⁵ (~5,792)
* **x=6:** y ≈ 2¹²·⁵ (~5,792)
* **x=7:** y ≈ 2¹²·⁶ (~6,452) **[Peak Region]**
* **x=8:** y ≈ 2¹²·⁵ (~5,792)
* **x=9:** y ≈ 2¹² (4,096)
* **x=10:** y ≈ 2¹¹·⁵ (~2,896)
* **x=11:** y ≈ 2¹¹ (2,048)
* **x=12:** y ≈ 2¹⁰·⁸ (~1,740)
* **x=13:** y ≈ 2¹⁰·⁵ (~1,448)
* **x=14:** y ≈ 2¹⁰ (1,024)
* **x=15:** y ≈ 2⁹·⁵ (~724)
* **x=16:** y ≈ 2⁹ (512)
* **x=17:** y ≈ 2⁸·⁸ (~445)
* **x=18:** y ≈ 2⁸·⁵ (~362)
* **x=19:** y ≈ 2⁷·⁵ (~181)
* **x=20:** y ≈ 2⁸ (256)
* **x=21:** y ≈ 2⁶·⁵ (~91)
* **x=22:** y ≈ 2⁵·² (~37)
* **x=23:** y ≈ 2⁶·⁹ (~119)
* **x=24:** y ≈ 2²·⁶ (~6)
* **x=25:** y ≈ 2²·⁴ (~5)
* **x=26:** y ≈ 2³·⁷ (~13)
**Trend Verification:**
The visual trend shows a rapid increase from x=1 to a plateau/peak between x=5 and x=8. Following this peak, there is a consistent, gradual decline in bar height (number of snapshots) as the number of past actions increases from x=9 to x=22. The trend becomes irregular at the tail end (x=23 to x=26), with a small spike at x=23 and a significant drop at x=24 and x=25, before a slight rise at x=26.
### Key Observations
1. **Peak Region:** The highest concentration of snapshots occurs for systems/states with approximately 5 to 8 past actions.
2. **Right Skew:** The distribution has a long tail to the right, meaning snapshots with a high number of past actions (e.g., >20) are relatively rare.
3. **Logarithmic Scale:** The use of a log₂ y-axis is crucial. It reveals that the difference between the peak (~6,000 snapshots) and the tail (~5-13 snapshots) is over three orders of magnitude.
4. **Tail Anomalies:** The data does not decline smoothly at the extreme right. The values for x=24 and x=25 are notably lower than their neighbors, suggesting these specific counts of past actions are particularly uncommon in the dataset. The value at x=26 is higher than at x=25.
5. **Zero Actions:** There is no bar for x=0, indicating either zero snapshots with zero past actions or that this category was not plotted.
### Interpretation
This chart likely represents the state distribution of a system where "snapshots" are taken, and each snapshot records the number of preceding "actions." The data suggests the system spends most of its time in states with a moderate history (5-8 actions). States with very short histories (1-3 actions) are less common, possibly representing initialization phases. States with very long histories (>20 actions) are rare, which could indicate that the system is frequently reset, pruned, or that long sequences naturally terminate or become unstable.
The logarithmic scale emphasizes that the system's behavior is dominated by states in the middle of the distribution. The anomalies in the tail (x=24,25) might be artifacts of the data collection process, specific constraints in the system's design, or simply statistical noise due to the very low counts. The overall pattern is characteristic of many natural and computational processes where intermediate complexity is most stable or frequently observed.