## Bar Chart: Relationship Between Past Actions and Snapshots
### Overview
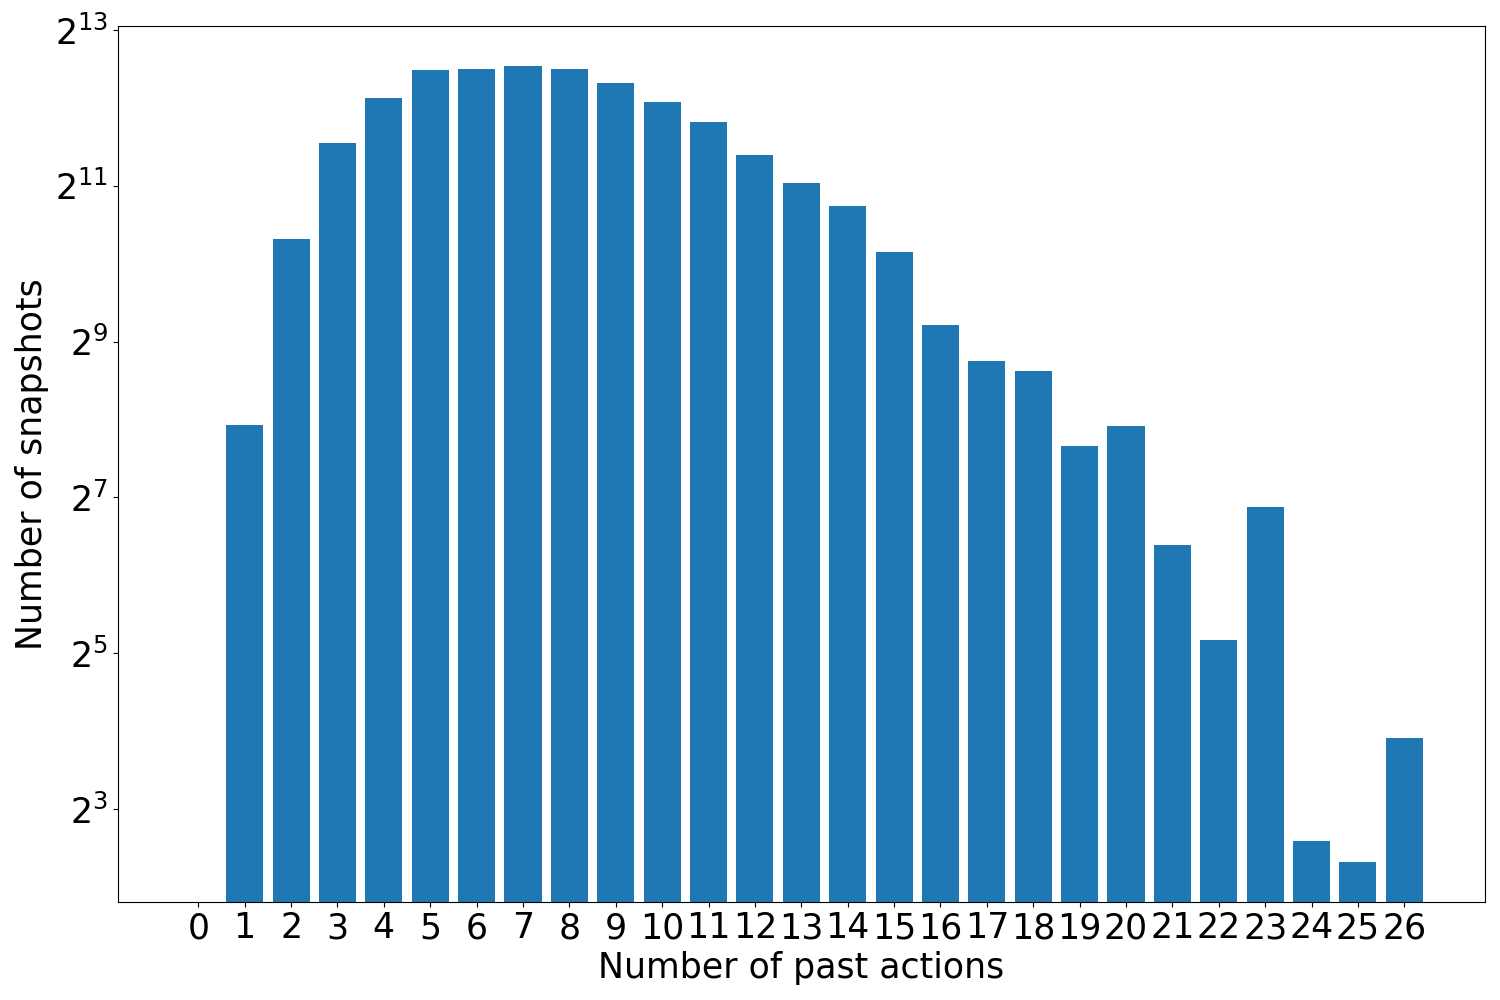
The chart visualizes the relationship between the number of past actions (x-axis) and the number of snapshots (y-axis, logarithmic scale). The y-axis ranges from 2³ to 2¹³, while the x-axis spans 0 to 26 past actions. Bars represent the frequency of snapshots, peaking at ~6 past actions and declining thereafter, with notable fluctuations.
### Components/Axes
- **X-axis**: "Number of past actions" (0–26, linear scale).
- **Y-axis**: "Number of snapshots" (logarithmic scale, 2³ to 2¹³).
- **Bars**: Blue vertical bars representing snapshot counts. No legend or additional labels are present.
### Detailed Analysis
- **X=0**: No bar (assumed 0 snapshots).
- **X=1**: ~2⁸ snapshots.
- **X=2**: ~2¹⁰ snapshots.
- **X=3**: ~2¹¹ snapshots.
- **X=4**: ~2¹² snapshots.
- **X=5**: ~2¹² snapshots.
- **X=6**: ~2¹² snapshots (peak).
- **X=7–10**: Gradual decline to ~2¹¹.5 snapshots.
- **X=11–15**: Further decline to ~2⁹ snapshots.
- **X=16–18**: Drop to ~2⁸.5 snapshots.
- **X=19**: ~2⁷.5 snapshots.
- **X=20**: ~2⁶.5 snapshots.
- **X=21**: ~2⁵ snapshots.
- **X=22**: ~2⁵ snapshots.
- **X=23**: ~2⁷ snapshots (anomaly).
- **X=24**: ~2⁴ snapshots.
- **X=25**: ~2³ snapshots.
- **X=26**: ~2⁴ snapshots.
### Key Observations
1. **Peak at X=6**: The highest number of snapshots (~2¹²) occurs at 6 past actions, suggesting optimal performance or data collection efficiency at this point.
2. **Decline Post-Peak**: After X=6, the number of snapshots decreases exponentially, indicating diminishing returns with additional actions.
3. **Anomalies**: A sharp drop at X=20 (~2⁶.5) followed by a rebound at X=23 (~2⁷) and subsequent decline suggests potential data irregularities or external factors.
4. **Logarithmic Scale**: The y-axis compresses large value ranges, emphasizing exponential growth/decline trends.
### Interpretation
The data implies that increasing past actions beyond 6 yields fewer snapshots, highlighting a potential inefficiency or saturation point. The anomalies at X=20–26 may reflect outliers, data collection errors, or contextual shifts (e.g., system resets). The logarithmic scale underscores the exponential nature of the relationship, making it easier to visualize trends across orders of magnitude. This pattern could inform resource allocation strategies, emphasizing the importance of balancing action frequency with snapshot utility.