## Bar Chart: LLM Model Performance Comparison
### Overview
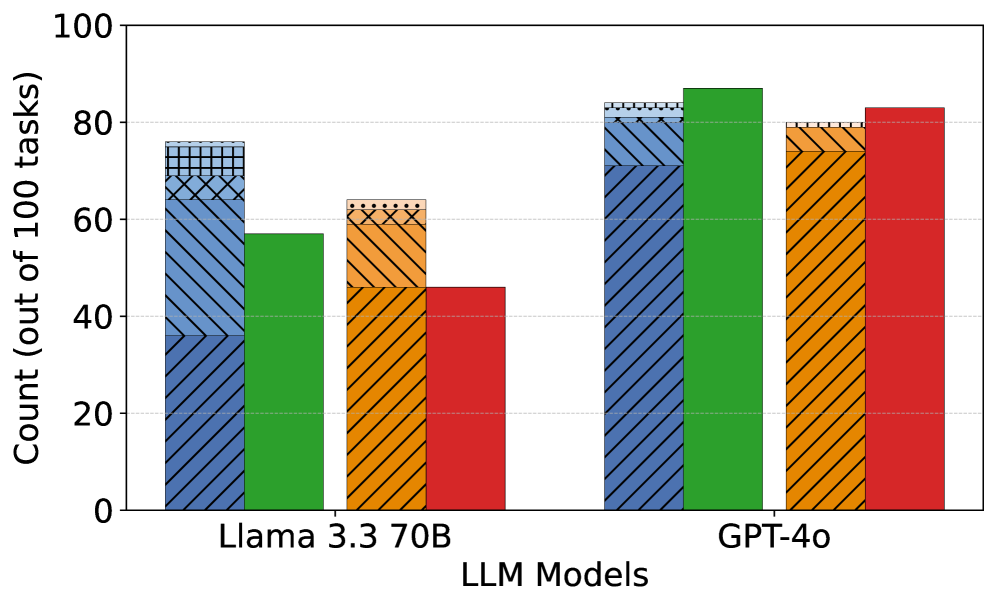
The image is a bar chart comparing the performance of two Large Language Models (LLMs), "Llama 3.3 70B" and "GPT-4o", across an unspecified set of tasks. The y-axis represents the count (out of 100 tasks), presumably indicating the number of tasks successfully completed or a similar performance metric. The chart displays four different colored bars for each model, each representing a different aspect of performance.
### Components/Axes
* **X-axis:** "LLM Models" with two categories: "Llama 3.3 70B" and "GPT-4o".
* **Y-axis:** "Count (out of 100 tasks)" with a scale from 0 to 100, marked at intervals of 20 (0, 20, 40, 60, 80, 100).
* **Bars:** Four bars for each LLM model, each with a distinct color and pattern. The colors are blue with diagonal lines, green, orange with diagonal lines, and red. The meaning of each color is not specified in the image.
### Detailed Analysis
**Llama 3.3 70B:**
* **Blue (diagonal lines):** The bar extends to approximately 68 out of 100 tasks.
* **Green:** The bar extends to approximately 57 out of 100 tasks.
* **Orange (diagonal lines):** The bar extends to approximately 47 out of 100 tasks.
* **Red:** The bar extends to approximately 47 out of 100 tasks.
**GPT-4o:**
* **Blue (diagonal lines):** The bar extends to approximately 82 out of 100 tasks.
* **Green:** The bar extends to approximately 88 out of 100 tasks.
* **Orange (diagonal lines):** The bar extends to approximately 80 out of 100 tasks.
* **Red:** The bar extends to approximately 83 out of 100 tasks.
### Key Observations
* GPT-4o consistently outperforms Llama 3.3 70B across all four categories represented by the different colored bars.
* The green bar shows the highest performance for GPT-4o, reaching approximately 88 out of 100 tasks.
* The performance of Llama 3.3 70B is significantly lower than GPT-4o in all categories.
### Interpretation
The bar chart provides a direct comparison of the performance of two LLMs, Llama 3.3 70B and GPT-4o. The data clearly indicates that GPT-4o performs better across the board. Without a legend, the specific meaning of each colored bar is unknown, but the consistent outperformance of GPT-4o suggests it is a more capable model based on the metrics being measured. The chart highlights the relative strengths and weaknesses of each model, although the specific tasks and performance metrics remain undefined.