\n
## Bar Chart: LLM Performance Comparison
### Overview
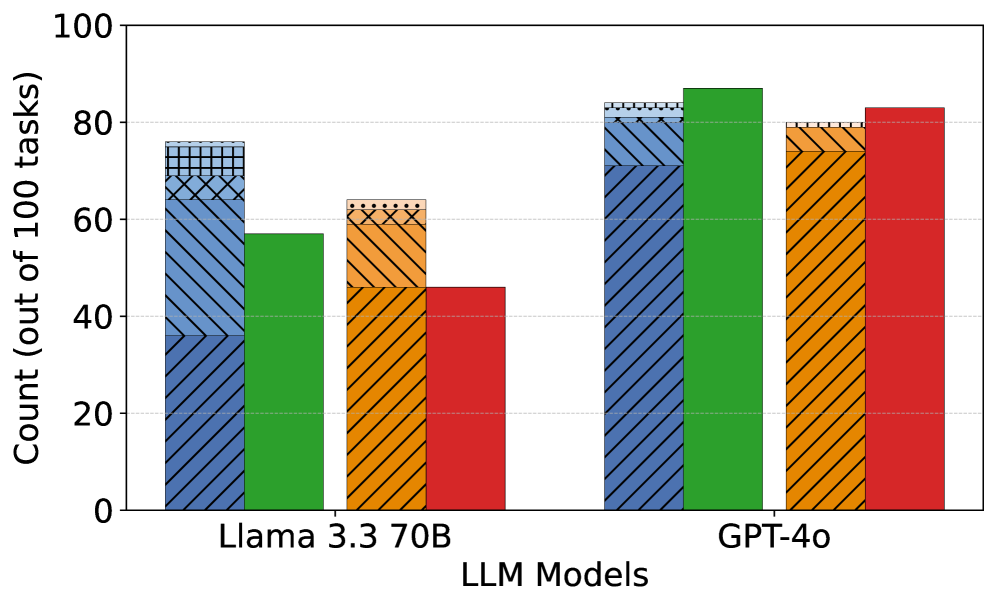
This bar chart compares the performance of three Large Language Models (LLMs) – Llama 3.3 70B and GPT-40 – across a set of tasks. The performance is measured by the count of tasks successfully completed out of 100. Each LLM has four bars representing different performance levels, visually distinguished by color and pattern.
### Components/Axes
* **X-axis:** "LLM Models" with categories: "Llama 3.3 70B", and "GPT-40".
* **Y-axis:** "Count (out of 100 tasks)" ranging from 0 to 100, with increments of 10.
* **Bars:** Each LLM has four bars representing different performance levels.
* **Colors/Patterns:**
* Dark Blue: Hatch pattern
* Green: Solid color
* Orange: Solid color
* Red: Solid color
### Detailed Analysis
The chart presents performance data for each LLM, broken down into four categories represented by the different colored bars.
**Llama 3.3 70B:**
* Dark Blue Bar: The line slopes upward, starting at approximately 72 and reaching a maximum of approximately 78.
* Green Bar: The line slopes downward, starting at approximately 56 and reaching a minimum of approximately 52.
* Orange Bar: The line slopes upward, starting at approximately 54 and reaching a maximum of approximately 60.
* Red Bar: The line slopes downward, starting at approximately 48 and reaching a minimum of approximately 44.
**GPT-40:**
* Dark Blue Bar: The line slopes upward, starting at approximately 82 and reaching a maximum of approximately 86.
* Green Bar: The line slopes upward, starting at approximately 84 and reaching a maximum of approximately 90.
* Orange Bar: The line slopes downward, starting at approximately 78 and reaching a minimum of approximately 74.
* Red Bar: The line slopes downward, starting at approximately 76 and reaching a minimum of approximately 72.
### Key Observations
* GPT-40 consistently outperforms Llama 3.3 70B across all performance categories.
* For both models, the dark blue and green bars show the highest and lowest performance, respectively.
* The difference in performance between GPT-40 and Llama 3.3 70B is most pronounced in the dark blue category.
### Interpretation
The data suggests that GPT-40 is a more capable LLM than Llama 3.3 70B, achieving higher counts of successful tasks across all measured categories. The consistent pattern of dark blue being the highest and green being the lowest suggests that these categories represent the easiest and most difficult tasks, respectively. The larger gap in the dark blue category indicates that GPT-40 excels at the simpler tasks, while the smaller gap in the red category suggests a more comparable performance on the most challenging tasks. This chart provides a quantitative comparison of the two models, highlighting the strengths of GPT-40. The use of stacked bars allows for a clear visual comparison of performance across different categories for each model.