## Violin Plot: Risk Preferences of Models
### Overview
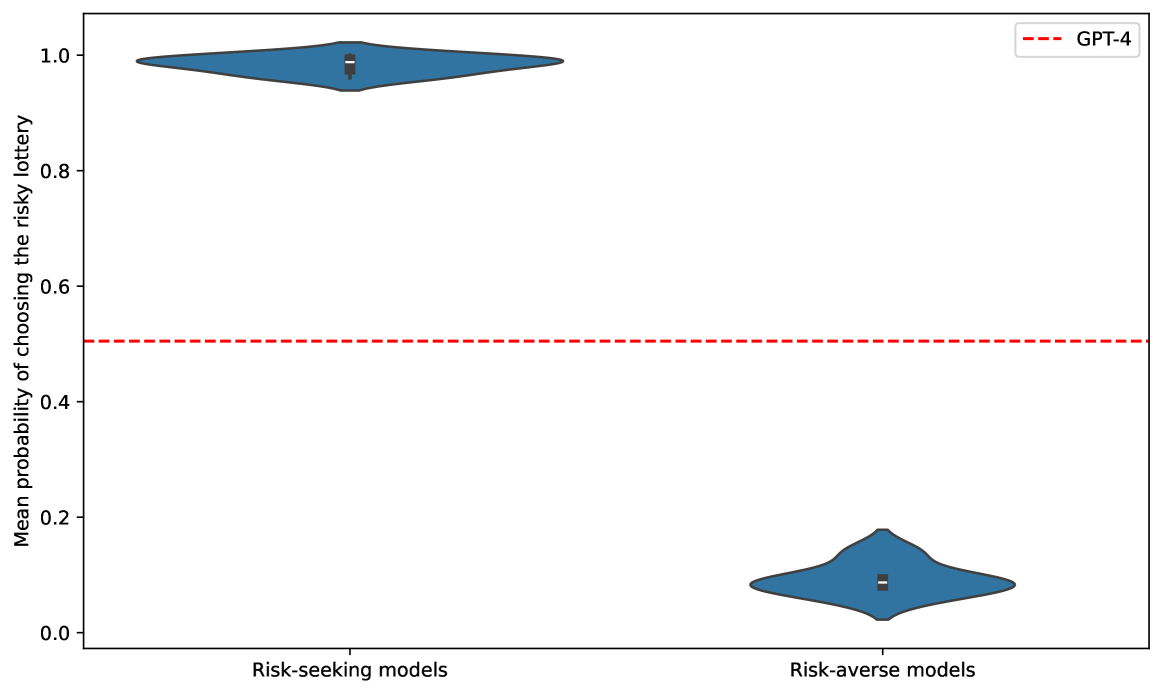
The image presents a comparative violin plot analyzing the risk preferences of two model types: "Risk-seeking models" and "Risk-averse models." The y-axis represents the "Mean probability of choosing the risky lottery" (0.0–1.0), while the x-axis categorizes the models. A red dashed line at 0.5 is labeled "GPT-4," serving as a reference threshold. The plot uses blue shaded distributions to visualize data density.
---
### Components/Axes
- **X-axis**:
- Labels: "Risk-seeking models" (left) and "Risk-averse models" (right).
- **Y-axis**:
- Title: "Mean probability of choosing the risky lottery."
- Scale: 0.0 (bottom) to 1.0 (top), with gridlines at 0.2, 0.4, 0.6, 0.8, and 1.0.
- **Legend**:
- Position: Top-right corner.
- Content: Red dashed line labeled "GPT-4."
- **Plot Elements**:
- Blue violin plots for each model type.
- Black horizontal lines within violins indicating median values.
- White background with no gridlines.
---
### Detailed Analysis
1. **Risk-seeking models**:
- Violin plot spans **0.9–1.0** with a narrow distribution.
- Median (black line) at **~0.98**.
- Density peaks near 1.0, indicating strong preference for risk.
2. **Risk-averse models**:
- Violin plot spans **0.0–0.2** with a wider distribution.
- Median (black line) at **~0.08**.
- Density peaks near 0.1, showing avoidance of risk.
3. **GPT-4 reference**:
- Red dashed line at **0.5** (center of y-axis).
- No direct data point associated with GPT-4; serves as a comparative benchmark.
---
### Key Observations
- **Risk-seeking models** consistently exhibit probabilities **>0.9**, far exceeding the GPT-4 threshold.
- **Risk-averse models** cluster **<0.2**, with significant variability (wider violin spread).
- GPT-4’s 0.5 threshold acts as a clear demarcation between the two model types.
- No overlapping distributions between risk-seeking and risk-averse models.
---
### Interpretation
The data demonstrates a stark dichotomy in risk preferences:
- **Risk-seeking models** prioritize high-risk, high-reward outcomes, with near-universal selection of the risky lottery.
- **Risk-averse models** exhibit caution, with most choices avoiding the risky option. The wider spread suggests heterogeneity in risk tolerance within this group.
- GPT-4’s 0.5 threshold may represent a baseline for balanced risk assessment, contrasting sharply with both model types. This could imply that GPT-4’s risk preferences are intermediate or context-dependent, unlike the polarized extremes of the specialized models.
The plot underscores the importance of model design in risk-related decision-making tasks, highlighting how architectural choices (e.g., risk-seeking vs. risk-averse) fundamentally alter behavioral outcomes.