## Directed Acyclic Graph: Causal Diagram
### Overview
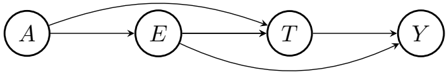
The image presents a directed acyclic graph (DAG) representing a causal model. It consists of four nodes labeled A, E, T, and Y, connected by directed edges (arrows) indicating causal relationships between the variables.
### Components/Axes
* **Nodes:** Four nodes, each enclosed in a circle, labeled A, E, T, and Y.
* **Edges:** Directed edges (arrows) connecting the nodes, representing causal relationships.
### Detailed Analysis
The diagram shows the following relationships:
1. **A -> E:** A directed edge from node A to node E.
2. **A -> T:** A curved directed edge from node A to node T.
3. **E -> T:** A directed edge from node E to node T.
4. **E -> Y:** A curved directed edge from node E to node Y.
5. **T -> Y:** A directed edge from node T to node Y.
### Key Observations
* The graph is acyclic, meaning there are no directed cycles.
* Node A has two outgoing edges, indicating it influences both E and T.
* Node E has two outgoing edges, indicating it influences both T and Y.
* Node T has one outgoing edge, indicating it influences Y.
* Node Y has no outgoing edges.
### Interpretation
The DAG represents a causal model where:
* A influences E and T.
* E influences T and Y.
* T influences Y.
The curved edges suggest a more complex or indirect relationship between the connected nodes. The absence of cycles implies that no variable directly or indirectly influences itself. This type of diagram is commonly used in causal inference to represent assumptions about the causal relationships between variables and to identify potential confounding variables.