## Flowchart Diagram: Process Flow with Feedback Loops
### Overview
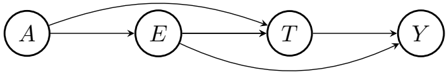
The image depicts a directed flowchart with four nodes labeled **A**, **E**, **T**, and **Y**. Arrows indicate directional relationships between nodes, including feedback loops and a direct bypass connection. The diagram suggests a sequential process with potential for iterative or cyclical operations.
### Components/Axes
- **Nodes**:
- **A** (starting point)
- **E** (intermediate node with feedback to A)
- **T** (intermediate node with feedback from Y)
- **Y** (terminal node with feedback to T)
- **Edges**:
- **A → E**: Primary forward path
- **E → T**: Primary forward path
- **T → Y**: Primary forward path
- **E → A**: Feedback loop (backward connection)
- **Y → T**: Feedback loop (backward connection)
- **A → T**: Direct bypass connection (shortcut)
### Detailed Analysis
1. **Primary Path**:
- The main sequence progresses as **A → E → T → Y**.
- This represents a linear workflow from initiation (A) to termination (Y).
2. **Feedback Loops**:
- **E → A**: Allows re-initiation or revision of the process at node A after reaching E.
- **Y → T**: Enables re-evaluation or correction at node T after completing the process at Y.
3. **Bypass Connection**:
- **A → T**: Provides an alternative route to skip node E, suggesting conditional or optional steps in the workflow.
### Key Observations
- The diagram emphasizes **non-linear progression** due to feedback loops, indicating potential for iterative refinement.
- The **direct A → T** edge introduces ambiguity about process efficiency or decision points.
- No explicit termination condition is defined for the feedback loops, implying possible infinite cycles.
### Interpretation
This flowchart likely models a **decision-making process** or **system workflow** with:
- **Error correction**: Feedback loops (E→A, Y→T) allow revisiting prior stages for adjustments.
- **Optimization**: The A→T bypass may represent a "fast track" for experienced users or critical paths.
- **Cyclical risk**: Without termination conditions, the system could enter infinite loops (e.g., E→A→E→A...).
The absence of quantitative data or probabilistic weights on edges suggests the diagram focuses on **structural relationships** rather than performance metrics. The design prioritizes flexibility and adaptability over rigid sequencing.