# Technical Document Extraction: Bar Chart Analysis
## Chart Structure
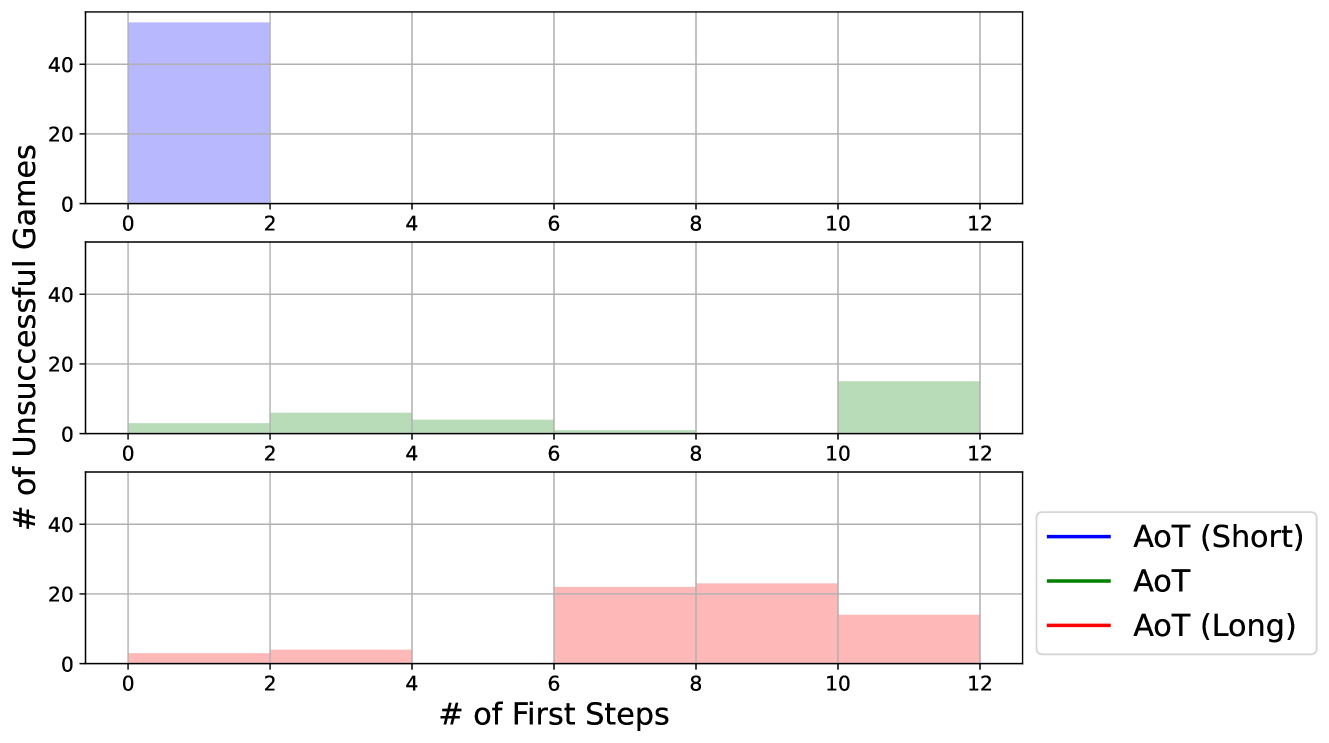
- **Chart Type**: Stacked bar charts (3 separate charts)
- **Orientation**: Vertical bars
- **Axes**:
- **X-axis**: "# of First Steps" (0–12, increments of 2)
- **Y-axis**: "# of Unsuccessful Games" (0–40, increments of 20)
## Legend
| Color | Label |
|-------------|----------------|
| Blue | AoT (Short) |
| Green | AoT |
| Red | AoT (Long) |
## Data Points
### Chart 1: AoT (Short) [Blue]
- **X=0**: Y=40 (Single bar)
- **X=2–12**: No bars (Y=0)
### Chart 2: AoT [Green]
- **X=2**: Y≈5
- **X=4**: Y≈7
- **X=6**: Y≈3
- **X=10**: Y≈15 (Tallest bar)
- **X=0,8,12**: No bars
### Chart 3: AoT (Long) [Red]
- **X=6**: Y≈20
- **X=8**: Y≈22 (Tallest bar)
- **X=10**: Y≈15
- **X=12**: Y≈10
- **X=0,2,4**: No bars
## Key Trends
1. **AoT (Short)**:
- All unsuccessful games occur at **0 first steps**
- No activity beyond X=0
2. **AoT**:
- Unsuccessful games distributed across **2–10 first steps**
- Peak at **X=10** (Y=15)
3. **AoT (Long)**:
- Activity concentrated at **6–12 first steps**
- Peak at **X=8** (Y=22)
- Gradual decline from X=8 to X=12
## Observations
- **AoT (Long)** shows the most distributed pattern across first steps
- **AoT (Short)** exhibits a singular, high-value outlier at X=0
- **AoT** demonstrates moderate spread with a late-stage peak