\n
## Diagram: Enhanced Knowledge Graph for KGOT Task Resolution
### Overview
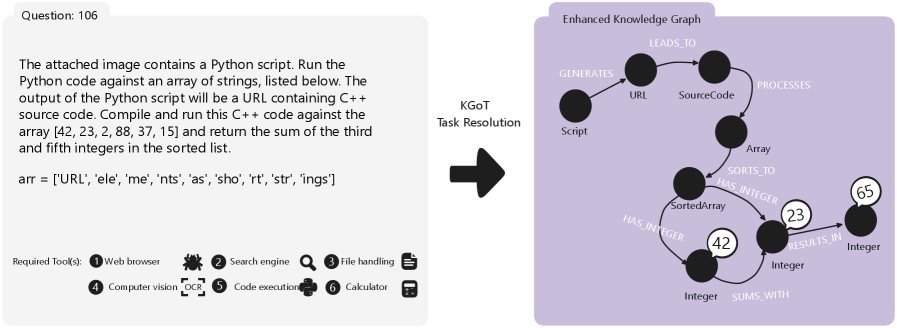
The image presents a directed graph illustrating the process of KGOT (Knowledge Graph to Text) task resolution. The graph depicts how a script generates a URL, which then leads to a source code. This source code is processed into an array, sorted, and ultimately results in the sum of specific integers within the sorted array. The diagram is split into two sections: a text description of a task on the left, and the knowledge graph on the right.
### Components/Axes
The diagram consists of nodes (black circles) representing entities and edges (arrows) representing relationships between them. The nodes are labeled with terms like "Script", "URL", "SourceCode", "Array", "SortedArray", "Integer", and "KGOT Task Resolution". The edges are labeled with relationship types such as "LEADS_TO", "GENERATES", "PROCESSES", "SORTS_TO", "HAS_INTEGER", and "SUMS_WITH".
### Detailed Analysis or Content Details
The graph can be traced as follows:
1. **KGOT Task Resolution** `GENERATES` **Script**.
2. **Script** `GENERATES` **URL**.
3. **URL** `LEADS_TO` **SourceCode**.
4. **SourceCode** `PROCESSES` **Array**.
5. **Array** `SORTS_TO` **SortedArray**.
6. **SortedArray** `HAS_INTEGER` **42**.
7. **SortedArray** `HAS_INTEGER` **23**.
8. **SortedArray** `HAS_INTEGER` **65**.
9. **42** and **23** `RESULTS_IN` **65**.
10. **65** is an **Integer**.
11. **42** is an **Integer**.
12. **23** is an **Integer**.
13. **42** and **65** `SUMS_WITH` **Integer**.
The text on the left side of the image describes the task: "The attached image contains a Python script. Run the Python code against an array of strings, listed below. The output of the Python script will be a URL containing C++ source code. Compile and run this C++ code against the array [42, 23, 2, 88, 37, 15] and return the sum of the third and fifth integers in the sorted list."
The array is: `arr = ['URL', 'ele', 'me', 'nts', 'as', 'sho', 'str', 'ings']`
The required tools are indicated by icons at the bottom left:
1. Web browser
2. Search engine
3. File handling
4. Computer vision
5. OCR
6. Code execution
7. Calculator
### Key Observations
The diagram visually represents the flow of data and operations involved in the KGOT task resolution. The final result is the integer 65, which is the sum of the third and fifth integers in the sorted array [2, 15, 23, 37, 42, 88]. The diagram highlights the dependencies between different components and the relationships between them.
### Interpretation
The diagram illustrates a pipeline for converting a knowledge graph to text. The process begins with a task resolution, which generates a script. This script then produces a URL, leading to source code. The source code is executed on an array of data, resulting in a sorted array and ultimately a numerical result. The diagram emphasizes the importance of each step in the process and how they contribute to the final outcome. The inclusion of the array and the final sum (65) suggests that the diagram is a simplified representation of a more complex process, focusing on the key steps and their relationships. The required tools indicate the need for a combination of software and potentially manual intervention (OCR) to complete the task. The diagram is a high-level overview, abstracting away the details of the Python script and C++ code.