## Line Chart: Accuracy vs. Sample Size
### Overview
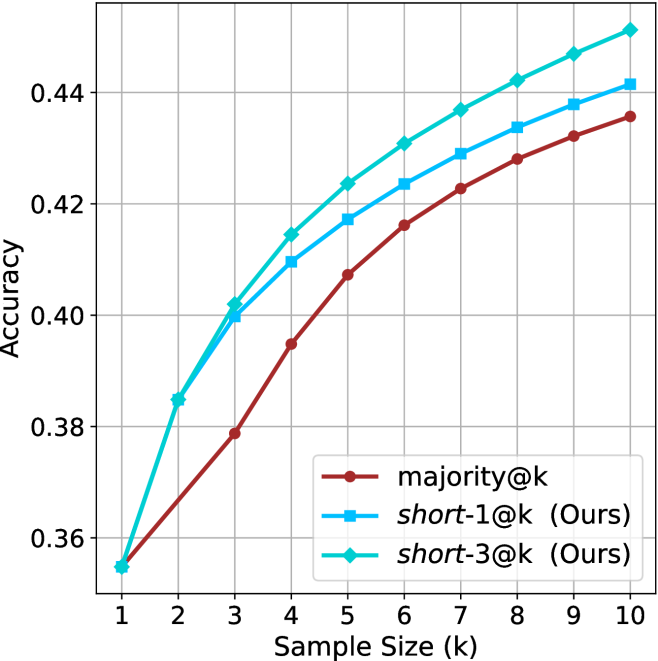
This image presents a line chart illustrating the relationship between sample size (k) and accuracy for three different methods: majority@k, short-1@k (labeled "Ours"), and short-3@k (labeled "Ours"). The chart displays how accuracy increases as the sample size grows for each method.
### Components/Axes
* **X-axis:** "Sample Size (k)" ranging from 1 to 10, with tick marks at each integer value.
* **Y-axis:** "Accuracy" ranging from 0.36 to 0.45, with tick marks at 0.36, 0.38, 0.40, 0.42, and 0.44.
* **Legend:** Located in the top-right corner, identifying the three data series:
* majority@k (represented by a red line with circular markers)
* short-1@k (Ours) (represented by a blue line with circular markers)
* short-3@k (Ours) (represented by a light blue/cyan line with circular markers)
* **Gridlines:** A light gray grid is present to aid in reading values.
### Detailed Analysis
* **majority@k (Red Line):** The line starts at approximately 0.365 at k=1. It increases steadily, but at a decreasing rate, reaching approximately 0.43 at k=10.
* k=1: Accuracy ≈ 0.365
* k=2: Accuracy ≈ 0.38
* k=3: Accuracy ≈ 0.395
* k=4: Accuracy ≈ 0.408
* k=5: Accuracy ≈ 0.418
* k=6: Accuracy ≈ 0.424
* k=7: Accuracy ≈ 0.428
* k=8: Accuracy ≈ 0.431
* k=9: Accuracy ≈ 0.433
* k=10: Accuracy ≈ 0.43
* **short-1@k (Ours) (Blue Line):** This line exhibits a steeper initial increase than majority@k. It starts at approximately 0.365 at k=1 and rises rapidly, reaching approximately 0.44 at k=7, then plateaus.
* k=1: Accuracy ≈ 0.365
* k=2: Accuracy ≈ 0.40
* k=3: Accuracy ≈ 0.42
* k=4: Accuracy ≈ 0.43
* k=5: Accuracy ≈ 0.435
* k=6: Accuracy ≈ 0.44
* k=7: Accuracy ≈ 0.44
* k=8: Accuracy ≈ 0.438
* k=9: Accuracy ≈ 0.437
* k=10: Accuracy ≈ 0.436
* **short-3@k (Ours) (Cyan Line):** This line shows the most rapid initial increase, starting at approximately 0.365 at k=1 and quickly surpassing the other two methods. It reaches approximately 0.445 at k=6 and then plateaus.
* k=1: Accuracy ≈ 0.365
* k=2: Accuracy ≈ 0.41
* k=3: Accuracy ≈ 0.43
* k=4: Accuracy ≈ 0.44
* k=5: Accuracy ≈ 0.443
* k=6: Accuracy ≈ 0.445
* k=7: Accuracy ≈ 0.445
* k=8: Accuracy ≈ 0.444
* k=9: Accuracy ≈ 0.443
* k=10: Accuracy ≈ 0.442
### Key Observations
* The "short-3@k (Ours)" method consistently outperforms both "majority@k" and "short-1@k (Ours)" across all sample sizes.
* All three methods show diminishing returns in accuracy as the sample size increases beyond k=6.
* The "short-1@k (Ours)" method initially lags behind "short-3@k (Ours)" but converges towards similar accuracy levels at larger sample sizes.
### Interpretation
The chart demonstrates the effectiveness of the "short-3@k (Ours)" method in achieving higher accuracy compared to the "majority@k" baseline and the "short-1@k (Ours)" variant, particularly with smaller sample sizes. The plateauing of accuracy for all methods at larger sample sizes suggests that the benefit of increasing the sample size diminishes beyond a certain point. This could indicate that the models are reaching their capacity to extract meaningful information from the data, or that the inherent noise in the data limits further improvements. The "Ours" methods likely leverage more sophisticated techniques than the simple majority voting scheme, allowing them to achieve better performance, especially when limited data is available. The difference between "short-1@k" and "short-3@k" suggests that utilizing more information (as in "short-3@k") initially provides a significant boost, but the marginal gain decreases as the sample size grows.