\n
## Line Chart: Accuracy vs. Sample Size for Three Methods
### Overview
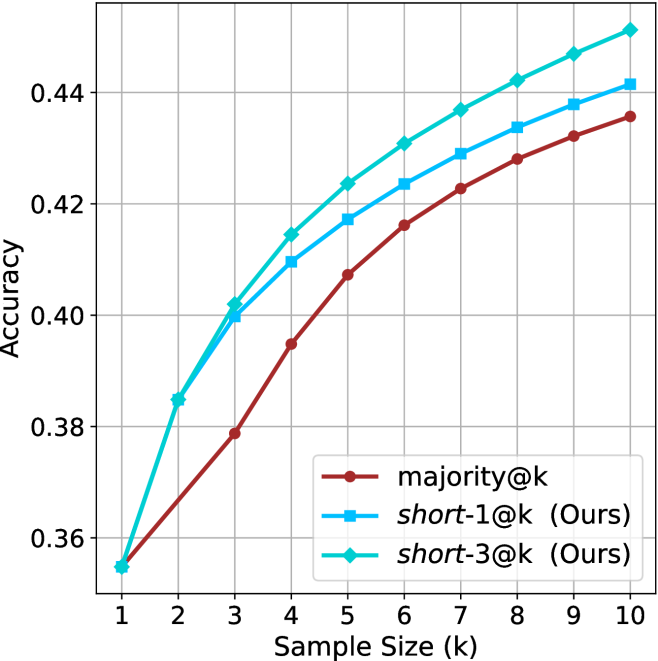
The image is a line chart comparing the performance of three different methods as a function of sample size. The chart plots "Accuracy" on the vertical axis against "Sample Size (k)" on the horizontal axis. All three methods show a positive trend, with accuracy increasing as the sample size grows from 1 to 10.
### Components/Axes
* **Chart Type:** Line chart with markers.
* **X-Axis:**
* **Label:** "Sample Size (k)"
* **Scale:** Linear, with integer markers from 1 to 10.
* **Y-Axis:**
* **Label:** "Accuracy"
* **Scale:** Linear, with major gridlines and labels at 0.36, 0.38, 0.40, 0.42, and 0.44.
* **Legend:**
* **Position:** Bottom-right corner of the plot area.
* **Items:**
1. `majority@k` - Represented by a brown line with circular markers.
2. `short-1@k (Ours)` - Represented by a blue line with square markers.
3. `short-3@k (Ours)` - Represented by a cyan (light blue) line with diamond markers.
* **Grid:** A light gray grid is present for both axes.
### Detailed Analysis
The chart displays three data series. Below is an approximate reconstruction of the data points based on visual inspection. Values are estimated to the nearest 0.005.
**Trend Verification:**
* **`majority@k` (Brown, Circles):** The line starts at the lowest point and slopes upward consistently, showing steady improvement.
* **`short-1@k (Ours)` (Blue, Squares):** The line starts higher than the brown line and slopes upward, maintaining a consistent lead over `majority@k`.
* **`short-3@k (Ours)` (Cyan, Diamonds):** The line starts at the same point as `short-1@k` but immediately diverges upward, maintaining the highest position throughout and showing the steepest initial slope.
**Data Point Extraction (Approximate Accuracy):**
| Sample Size (k) | `majority@k` (Brown) | `short-1@k (Ours)` (Blue) | `short-3@k (Ours)` (Cyan) |
| :--- | :--- | :--- | :--- |
| 1 | 0.355 | 0.355 | 0.355 |
| 2 | 0.368 | 0.385 | 0.385 |
| 3 | 0.379 | 0.400 | 0.402 |
| 4 | 0.395 | 0.410 | 0.415 |
| 5 | 0.407 | 0.417 | 0.424 |
| 6 | 0.416 | 0.424 | 0.431 |
| 7 | 0.423 | 0.429 | 0.437 |
| 8 | 0.428 | 0.434 | 0.442 |
| 9 | 0.432 | 0.438 | 0.447 |
| 10 | 0.436 | 0.442 | 0.452 |
### Key Observations
1. **Universal Improvement:** All three methods demonstrate a clear, monotonic increase in accuracy as the sample size (k) increases.
2. **Performance Hierarchy:** A consistent performance hierarchy is established from k=2 onward: `short-3@k` > `short-1@k` > `majority@k`. The two methods labeled "(Ours)" consistently outperform the `majority@k` baseline.
3. **Convergence at k=1:** All three methods begin at the exact same accuracy point (~0.355) when the sample size is 1.
4. **Diverging Gap:** The performance gap between the best method (`short-3@k`) and the baseline (`majority@k`) widens as k increases. At k=10, the gap is approximately 0.016 accuracy points.
5. **Relative Gain:** The `short-3@k` method shows a slightly greater relative improvement over `short-1@k` as k increases, suggesting it may scale better with more samples.
### Interpretation
This chart presents empirical evidence for the effectiveness of two proposed methods (`short-1@k` and `short-3@k`) against a baseline (`majority@k`) in a task where accuracy is measured. The key takeaway is that the proposed methods are superior, with `short-3@k` being the most effective.
The data suggests that the "short-3" variant is better at leveraging additional samples to improve its predictions or decisions. The fact that all methods start equally at k=1 implies the baseline is competitive with a single sample, but the proposed methods' architectures or algorithms allow them to extract more value from multiple samples (k > 1). The consistent, smooth curves indicate stable and predictable performance scaling. This type of analysis is common in machine learning and statistical method evaluation, where the goal is to show that a new technique provides a measurable and reliable improvement over existing approaches across a range of operational conditions (here, varying sample sizes).