## Line Chart: Accuracy vs. Sample Size (k)
### Overview
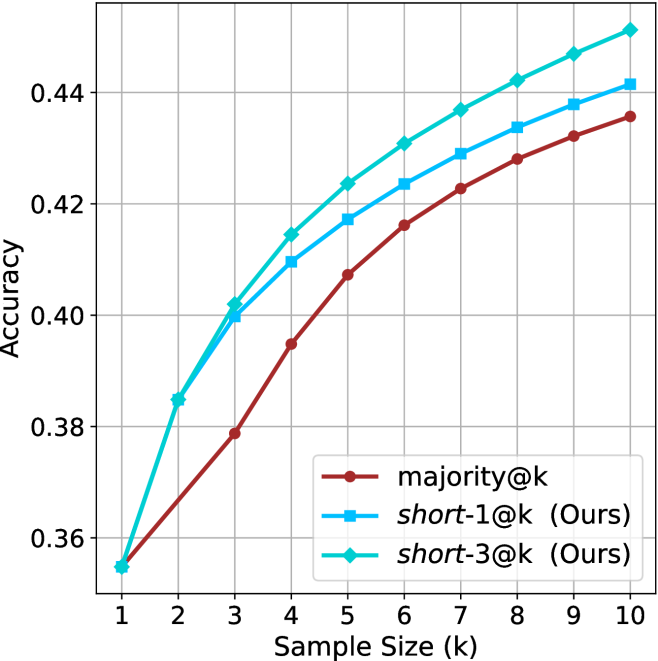
The chart compares the accuracy of three methods—majority@k, short-1@k (Ours), and short-3@k (Ours)—across sample sizes ranging from 1 to 10. Accuracy increases monotonically for all methods as sample size grows, with short-3@k consistently outperforming the others.
### Components/Axes
- **X-axis**: Sample Size (k) (integer values 1–10)
- **Y-axis**: Accuracy (decimal values 0.36–0.45)
- **Legend**:
- Red: majority@k
- Blue: short-1@k (Ours)
- Green: short-3@k (Ours)
- **Legend Position**: Bottom-right corner
### Detailed Analysis
1. **majority@k (Red Line)**:
- Starts at 0.36 (k=1) and increases gradually to 0.43 (k=10).
- Data points:
- k=1: 0.36
- k=2: 0.38
- k=3: 0.38
- k=4: 0.39
- k=5: 0.40
- k=6: 0.41
- k=7: 0.42
- k=8: 0.43
- k=9: 0.43
- k=10: 0.43
2. **short-1@k (Blue Line)**:
- Starts at 0.38 (k=1) and rises steeply to 0.44 (k=10).
- Data points:
- k=1: 0.38
- k=2: 0.40
- k=3: 0.40
- k=4: 0.41
- k=5: 0.42
- k=6: 0.42
- k=7: 0.43
- k=8: 0.43
- k=9: 0.44
- k=10: 0.44
3. **short-3@k (Green Line)**:
- Starts at 0.36 (k=1), jumps to 0.38 (k=2), then rises sharply to 0.45 (k=10).
- Data points:
- k=1: 0.36
- k=2: 0.38
- k=3: 0.40
- k=4: 0.41
- k=5: 0.42
- k=6: 0.43
- k=7: 0.43
- k=8: 0.44
- k=9: 0.44
- k=10: 0.45
### Key Observations
- **Performance Hierarchy**: short-3@k > short-1@k > majority@k across all k values.
- **Steepest Growth**: short-3@k shows the most significant improvement, especially between k=2 and k=10.
- **Convergence**: All methods plateau near 0.44–0.45 as k approaches 10.
### Interpretation
The data demonstrates that the proposed methods (short-1@k and short-3@k) outperform the majority@k baseline, with short-3@k achieving the highest accuracy. The consistent upward trend for all methods suggests that larger sample sizes improve performance, but the proposed methods scale more effectively. The green line’s rapid ascent indicates that short-3@k may leverage additional contextual or structural information in the data, making it particularly robust for larger datasets. This could have implications for applications requiring high accuracy with limited computational resources.