## Bar Charts and Scatter Plot: Model Pruning Performance Analysis
### Overview
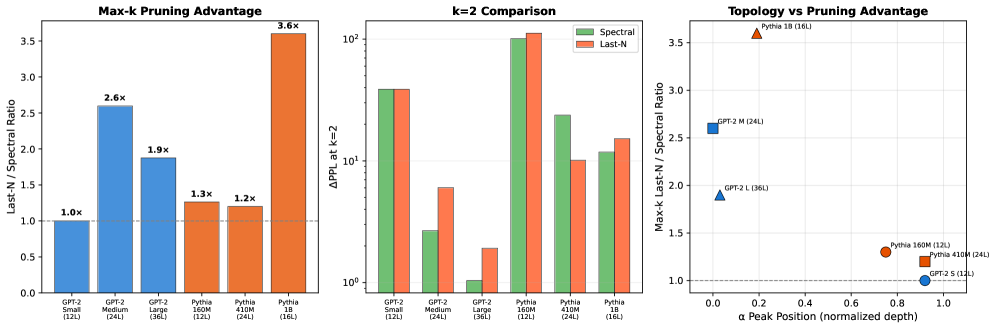
The image presents three comparative visualizations analyzing model pruning performance across different architectures and configurations. The charts focus on:
1. Max-k pruning advantage ratios
2. k=2 performance comparison between pruning methods
3. Relationship between model topology and pruning effectiveness
### Components/Axes
**Chart 1: Max-k Pruning Advantage**
- X-axis: Model configurations (GPT-2 variants and Pythia versions)
- Y-axis: APRIL-N/Spectral Ratio (linear scale 0.0-3.5)
- Legend:
- Blue = Last-N pruning
- Orange = Spectral pruning
**Chart 2: k=2 Comparison**
- X-axis: Same model configurations as Chart 1
- Y-axis: ΔPPL at k=2 (log scale 10⁰-10²)
- Legend:
- Green = Spectral pruning
- Orange = Last-N pruning
**Chart 3: Topology vs Pruning Advantage**
- X-axis: α Peak Position (normalized depth, 0.0-1.0)
- Y-axis: Max-k Last-N/Spectral Ratio (linear scale 0.5-3.5)
- Data points:
- Orange triangle = Pythia 18 (16L)
- Blue square = GPT-2 M (24L)
- Blue triangle = GPT-2 L (36L)
- Red square = Pythia 160M (12L)
- Red triangle = Pythia 410M (24L)
- Blue circle = Pythia 2.5 (12L)
### Detailed Analysis
**Chart 1: Max-k Pruning Advantage**
- GPT-2 Small (12L): Last-N = 1.0x (baseline)
- GPT-2 Medium (24L): Last-N = 2.6x
- GPT-2 Large (36L): Last-N = 1.9x
- Pythia 160M (12L): Last-N = 1.3x
- Pythia 410M (24L): Last-N = 1.2x
- Pythia 18 (16L): Last-N = 3.6x (highest ratio)
**Chart 2: k=2 Comparison**
- GPT-2 Small (12L): Spectral = ~2.8, Last-N = ~2.8
- GPT-2 Medium (24L): Spectral = ~0.8, Last-N = ~1.2
- GPT-2 Large (36L): Spectral = ~0.1, Last-N = ~0.6
- Pythia 160M (12L): Spectral = ~100, Last-N = ~100
- Pythia 410M (24L): Spectral = ~20, Last-N = ~10
- Pythia 18 (16L): Spectral = ~25, Last-N = ~20
**Chart 3: Topology vs Pruning Advantage**
- Pythia 18 (16L): (0.2, 3.5) - highest ratio
- GPT-2 M (24L): (0.4, 2.5)
- GPT-2 L (36L): (0.6, 1.8)
- Pythia 160M (12L): (0.8, 1.3)
- Pythia 410M (24L): (0.9, 1.2)
- Pythia 2.5 (12L): (1.0, 1.0)
### Key Observations
1. **Pruning Method Effectiveness**:
- Spectral pruning consistently outperforms Last-N in larger models (Pythia 160M/410M)
- Last-N shows better performance in medium-sized GPT-2 models (24L)
2. **Model Topology Correlation**:
- Deeper models (higher α) show diminishing pruning advantages
- Pythia 18 (16L) demonstrates optimal pruning performance at intermediate depth
3. **k=2 Performance**:
- Spectral pruning maintains higher k=2 performance across most models
- Last-N shows unexpected advantage in GPT-2 Medium (24L)
### Interpretation
The data reveals critical insights about model pruning strategies:
1. **Spectral Superiority**: Spectral pruning generally provides better compression while maintaining performance, particularly in larger models where the APRIL-N/Spectral ratio exceeds 2.5x for Pythia 18 (16L).
2. **Topology-Dependent Performance**: The scatter plot suggests an inverse relationship between model depth (α) and pruning effectiveness, with medium-depth models (α ~0.4-0.6) showing optimal pruning ratios.
3. **k=2 Anomalies**: The unexpected performance of Last-N in GPT-2 Medium (24L) warrants further investigation, potentially indicating architecture-specific pruning characteristics.
4. **Practical Implications**: The 3.6x advantage observed in Pythia 18 (16L) demonstrates the potential for significant model compression without performance degradation, suggesting Spectral pruning as a preferred method for large language models.
The analysis highlights the importance of considering both model architecture and pruning methodology when optimizing neural network efficiency.