## State Diagram: Finite State Machine
### Overview
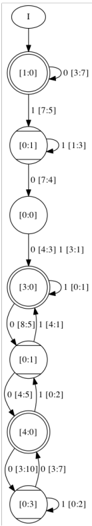
The image depicts a state diagram, representing a finite state machine. It consists of nodes representing states and directed edges representing transitions between states, labeled with input values and associated data.
### Components/Axes
* **Nodes:** Represent states, labeled with bracketed numbers (e.g., [1:0], [0:1], [0:0], [3:0], [4:0], [0:3]). The node labeled [1:0], [3:0], and [4:0] are double-circled, indicating accepting states.
* **Edges:** Represent transitions between states, labeled with an input value (0 or 1) and associated data in brackets (e.g., 0 [3:7], 1 [7:5]).
* **Start State:** The state labeled "1" at the top of the diagram is the start state.
### Detailed Analysis or ### Content Details
1. **Start State:**
* Node: 1
* Transition to [1:0]: Unlabeled arrow.
2. **State [1:0]:**
* Node: [1:0] (Accepting State)
* Transition to [0:1]: 1 [7:5]
* Self-loop: 0 [3:7]
3. **State [0:1]:**
* Node: [0:1]
* Transition to [0:0]: 0 [7:4]
* Self-loop: 1 [1:3]
4. **State [0:0]:**
* Node: [0:0]
* Transition to [3:0]: 0 [4:3]
* Transition to [3:0]: 1 [3:1]
5. **State [3:0]:**
* Node: [3:0] (Accepting State)
* Self-loop: 1 [0:1]
* Transition to [0:1]: 0 [8:5]
* Transition to [0:1]: 1 [4:1]
6. **State [4:0]:**
* Node: [4:0] (Accepting State)
* Transition to [0:3]: 0 [3:10]
* Transition to [0:3]: 0 [3:7]
7. **State [0:3]:**
* Node: [0:3]
* Self-loop: 1 [0:2]
8. **State [4:0]:**
* Node: [4:0]
* Transition to [0:1]: 0 [4:5]
* Transition to [0:1]: 1 [0:2]
### Key Observations
* The diagram represents a finite state machine with 7 states (excluding the initial state "1").
* States [1:0], [3:0], and [4:0] are accepting states.
* Transitions are labeled with input values (0 or 1) and associated data.
* Self-loops exist in states [1:0], [0:1], [3:0], and [0:3].
### Interpretation
The state diagram illustrates the behavior of a finite state machine. The machine transitions between states based on input values, and the accepting states indicate successful or valid outcomes. The data associated with each transition could represent costs, probabilities, or other relevant information for each state transition. The specific meaning of the bracketed numbers within the states and transitions is not clear from the diagram alone, but they likely represent some form of state or transition metadata.