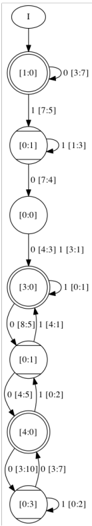
## Flowchart Diagram: State Transition System
### Overview
The image depicts a vertical flowchart representing a state transition system. Nodes are labeled with numerical pairs (e.g., [1:0], [0:1]), and transitions between nodes are annotated with directional arrows and labels containing numerical ratios (e.g., 0 [3:7], 1 [7:5]). The diagram includes loops and bidirectional connections, suggesting a probabilistic or weighted state machine.
### Components/Axes
- **Nodes**:
- Labeled with pairs in square brackets (e.g., [1:0], [0:1], [0:0], [3:0], [4:0], [0:3]).
- Positioned sequentially from top to bottom, with some nodes having self-loops.
- **Transitions**:
- Arrows indicate directionality between nodes.
- Labels on arrows include:
- A binary indicator (0 or 1) preceding a ratio in square brackets (e.g., 0 [3:7], 1 [7:5]).
- Ratios vary per transition (e.g., [3:10], [4:5], [0:2]).
- **Flow Direction**:
- Top-to-bottom progression with lateral and backward connections (e.g., [3:0] → [0:1] → [4:0] → [0:3]).
### Detailed Analysis
1. **Node [1:0]**:
- Self-loop: `0 [3:7]` (stays in state).
- Transition to [0:1]: `1 [7:5]`.
2. **Node [0:1]**:
- Transition to [0:0]: `0 [7:4]`.
- Self-loop: `1 [1:3]`.
3. **Node [0:0]**:
- Transition to [3:0]: `0 [4:3]`.
- Transition to [0:1]: `1 [3:1]`.
4. **Node [3:0]**:
- Transition to [0:1]: `1 [0:1]`.
- Transition to [4:0]: `0 [8:5]`.
5. **Node [4:0]**:
- Transition to [0:1]: `0 [4:5]`.
- Transition to [0:2]: `1 [0:2]`.
6. **Node [0:1] (lower instance)**:
- Transition to [4:0]: `0 [3:10]`.
- Transition to [0:3]: `1 [3:7]`.
7. **Node [0:3]**:
- Self-loop: `1 [0:2]`.
### Key Observations
- **State Hierarchy**: Nodes with higher first values (e.g., [3:0], [4:0]) appear mid-diagram, suggesting progression through stages.
- **Probabilistic Transitions**: Ratios (e.g., [3:7], [7:5]) may represent transition weights or probabilities.
- **Loops**: Multiple nodes have self-loops (e.g., [1:0], [0:1]), indicating potential for repeated states.
- **Bidirectional Flow**: Arrows connect nodes both upward and downward (e.g., [3:0] → [0:1] → [4:0]).
### Interpretation
The diagram likely models a system where states transition based on binary decisions (0/1) with associated ratios. For example:
- From [1:0], a "0" action retains the state with a 3:7 ratio, while a "1" action moves to [0:1] with a 7:5 ratio.
- The presence of loops suggests iterative processes or feedback mechanisms.
- The final node [0:3] has a self-loop with a 1:2 ratio, implying a terminal or stabilizing state.
This structure could represent decision trees, Markov chains, or workflow automation, where transitions depend on probabilistic outcomes or conditional logic.