TECHNICAL ASSET FINGERPRINT
6bd9206d03140f5b631de7be
Click to view fullscreen
Press ESC or click to close
FOUND IN PAPERS
EXPERT: healer-alpha-free VERSION 1
RUNTIME: free/openrouter/healer-alpha
INTEL_VERIFIED
## Stacked Bar Chart: Rating Distribution by Model
### Overview
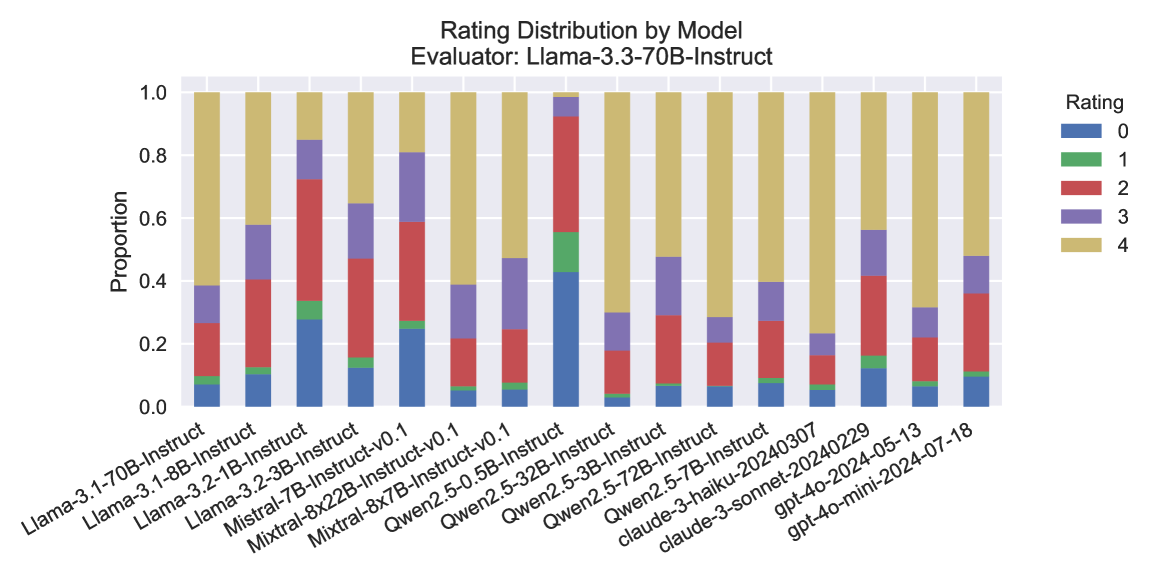
This is a stacked bar chart titled "Rating Distribution by Model" with the subtitle "Evaluator: Llama-3.3-70B-Instruct". It displays the proportional distribution of five rating categories (0 through 4) across 16 different large language models. The chart compares how the evaluator model (Llama-3.3-70B-Instruct) rated the outputs of various other models.
### Components/Axes
* **Chart Title:** "Rating Distribution by Model"
* **Subtitle/Evaluator:** "Evaluator: Llama-3.3-70B-Instruct"
* **Y-Axis:** Labeled "Proportion". Scale ranges from 0.0 to 1.0, with major tick marks at 0.0, 0.2, 0.4, 0.6, 0.8, and 1.0.
* **X-Axis:** Lists 16 model names. The labels are rotated approximately 45 degrees for readability.
* **Legend:** Located on the right side of the chart, titled "Rating". It maps colors to rating values:
* **Blue:** Rating 0
* **Green:** Rating 1
* **Red:** Rating 2
* **Purple:** Rating 3
* **Gold/Tan:** Rating 4
### Detailed Analysis
The chart consists of 16 vertical stacked bars, each representing a model. The total height of each bar is 1.0 (100%). The segments within each bar show the proportion of responses that received each rating (0-4). The order of segments from bottom to top is: Blue (0), Green (1), Red (2), Purple (3), Gold (4).
**Model-by-Model Analysis (from left to right):**
1. **Llama-3.1-70B-Instruct:** Dominated by Gold (4, ~60%), with smaller segments of Purple (3, ~12%), Red (2, ~18%), Green (1, ~5%), and Blue (0, ~5%).
2. **Llama-3.1-8B-Instruct:** Large Gold segment (4, ~42%), significant Purple (3, ~18%), Red (2, ~28%), small Green (1, ~5%), and Blue (0, ~7%).
3. **Llama-3.2-1B-Instruct:** Very large Gold segment (4, ~15%), large Purple (3, ~12%), very large Red (2, ~40%), small Green (1, ~5%), and moderate Blue (0, ~28%).
4. **Llama-3.2-3B-Instruct:** Large Gold (4, ~35%), moderate Purple (3, ~18%), large Red (2, ~32%), small Green (1, ~3%), and moderate Blue (0, ~12%).
5. **Mistral-7B-Instruct-v0.1:** Large Gold (4, ~20%), large Purple (3, ~22%), large Red (2, ~32%), small Green (1, ~2%), and moderate Blue (0, ~24%).
6. **Mixtral-8x22B-Instruct-v0.1:** Dominated by Gold (4, ~60%), with Purple (3, ~20%), Red (2, ~15%), Green (1, ~1%), and Blue (0, ~4%).
7. **Mixtral-8x7B-Instruct-v0.1:** Large Gold (4, ~52%), moderate Purple (3, ~22%), Red (2, ~18%), Green (1, ~2%), and Blue (0, ~6%).
8. **Qwen2.5-0.5B-Instruct:** **Outlier.** Very large Blue segment (0, ~42%), moderate Green (1, ~12%), large Red (2, ~38%), small Purple (3, ~5%), and very small Gold (4, ~3%).
9. **Qwen2.5-32B-Instruct:** Dominated by Gold (4, ~70%), with Purple (3, ~12%), Red (2, ~12%), Green (1, ~2%), and Blue (0, ~4%).
10. **Qwen2.5-3B-Instruct:** Large Gold (4, ~52%), moderate Purple (3, ~18%), Red (2, ~22%), Green (1, ~2%), and Blue (0, ~6%).
11. **Qwen2.5-72B-Instruct:** Large Gold (4, ~70%), moderate Purple (3, ~12%), Red (2, ~12%), Green (1, ~2%), and Blue (0, ~4%).
12. **Qwen2.5-7B-Instruct:** Large Gold (4, ~60%), moderate Purple (3, ~12%), Red (2, ~22%), Green (1, ~2%), and Blue (0, ~4%).
13. **claude-3-haiku-20240307:** Large Gold (4, ~60%), moderate Purple (3, ~18%), Red (2, ~15%), Green (1, ~2%), and Blue (0, ~5%).
14. **claude-3-sonnet-20240229:** Large Gold (4, ~78%), small Purple (3, ~8%), Red (2, ~8%), Green (1, ~2%), and Blue (0, ~4%).
15. **gpt-4o-2024-05-13:** Large Gold (4, ~45%), moderate Purple (3, ~15%), large Red (2, ~28%), small Green (1, ~5%), and moderate Blue (0, ~7%).
16. **gpt-4o-mini-2024-07-18:** Large Gold (4, ~52%), moderate Purple (3, ~12%), large Red (2, ~25%), small Green (1, ~5%), and moderate Blue (0, ~6%).
### Key Observations
1. **High-Performing Cluster:** Models like `claude-3-sonnet-20240229`, `Qwen2.5-32B-Instruct`, and `Qwen2.5-72B-Instruct` show a very high proportion of Rating 4 (Gold), exceeding 70%. This suggests the evaluator consistently gave them top marks.
2. **Significant Outlier:** `Qwen2.5-0.5B-Instruct` is a clear outlier. It has the highest proportion of Rating 0 (Blue, ~42%) and the lowest proportion of Rating 4 (Gold, ~3%) of any model. Its distribution is inverted compared to most others.
3. **Mid-Range Variability:** Models like `Llama-3.2-1B-Instruct` and `Mistral-7B-Instruct-v0.1` show a more even spread across ratings 0, 2, and 3, with less dominance from the top rating (4).
4. **Consistent Low Ratings for Some:** Ratings 1 (Green) are consistently a very small proportion (<5%) across all models, suggesting the evaluator rarely assigned this middle-low score.
5. **Evaluator Bias:** The chart reveals the subjective judgment of the specific evaluator model (`Llama-3.3-70B-Instruct`). Its ratings are not an absolute measure of quality but a relative comparison based on its own criteria.
### Interpretation
This chart provides a comparative snapshot of model performance as judged by a single, powerful evaluator model (`Llama-3.3-70B-Instruct`). The data suggests a few key insights:
* **Model Size vs. Performance:** There isn't a strict linear relationship between model size (e.g., 0.5B vs. 72B) and rating. While the smallest Qwen model performed worst, other small models like `Llama-3.2-1B-Instruct` had a more mixed distribution. Larger models from the same family (e.g., Qwen2.5 32B/72B) generally performed better than their smaller counterparts.
* **Evaluator Consistency:** The evaluator appears to use Rating 4 (Gold) generously for models it deems high-quality, often allocating over 50% of responses to this category. Conversely, it uses Rating 1 (Green) sparingly, indicating a possible bimodal tendency in its scoring (either very good or mediocre/poor).
* **The "Qwen2.5-0.5B-Instruct" Anomaly:** The drastic underperformance of this model could indicate a failure mode, a mismatch between the model's capabilities and the evaluation tasks, or a specific weakness that the evaluator is sensitive to. It serves as a critical data point for debugging or understanding model limitations.
* **Relative, Not Absolute:** It is crucial to remember this is a *distribution of ratings from one model about others*. A high proportion of Rating 4 does not guarantee objective superiority; it means the evaluator model preferred that model's outputs according to its internal metrics. This chart is most useful for relative benchmarking within this specific evaluation framework.
DECODING INTELLIGENCE...