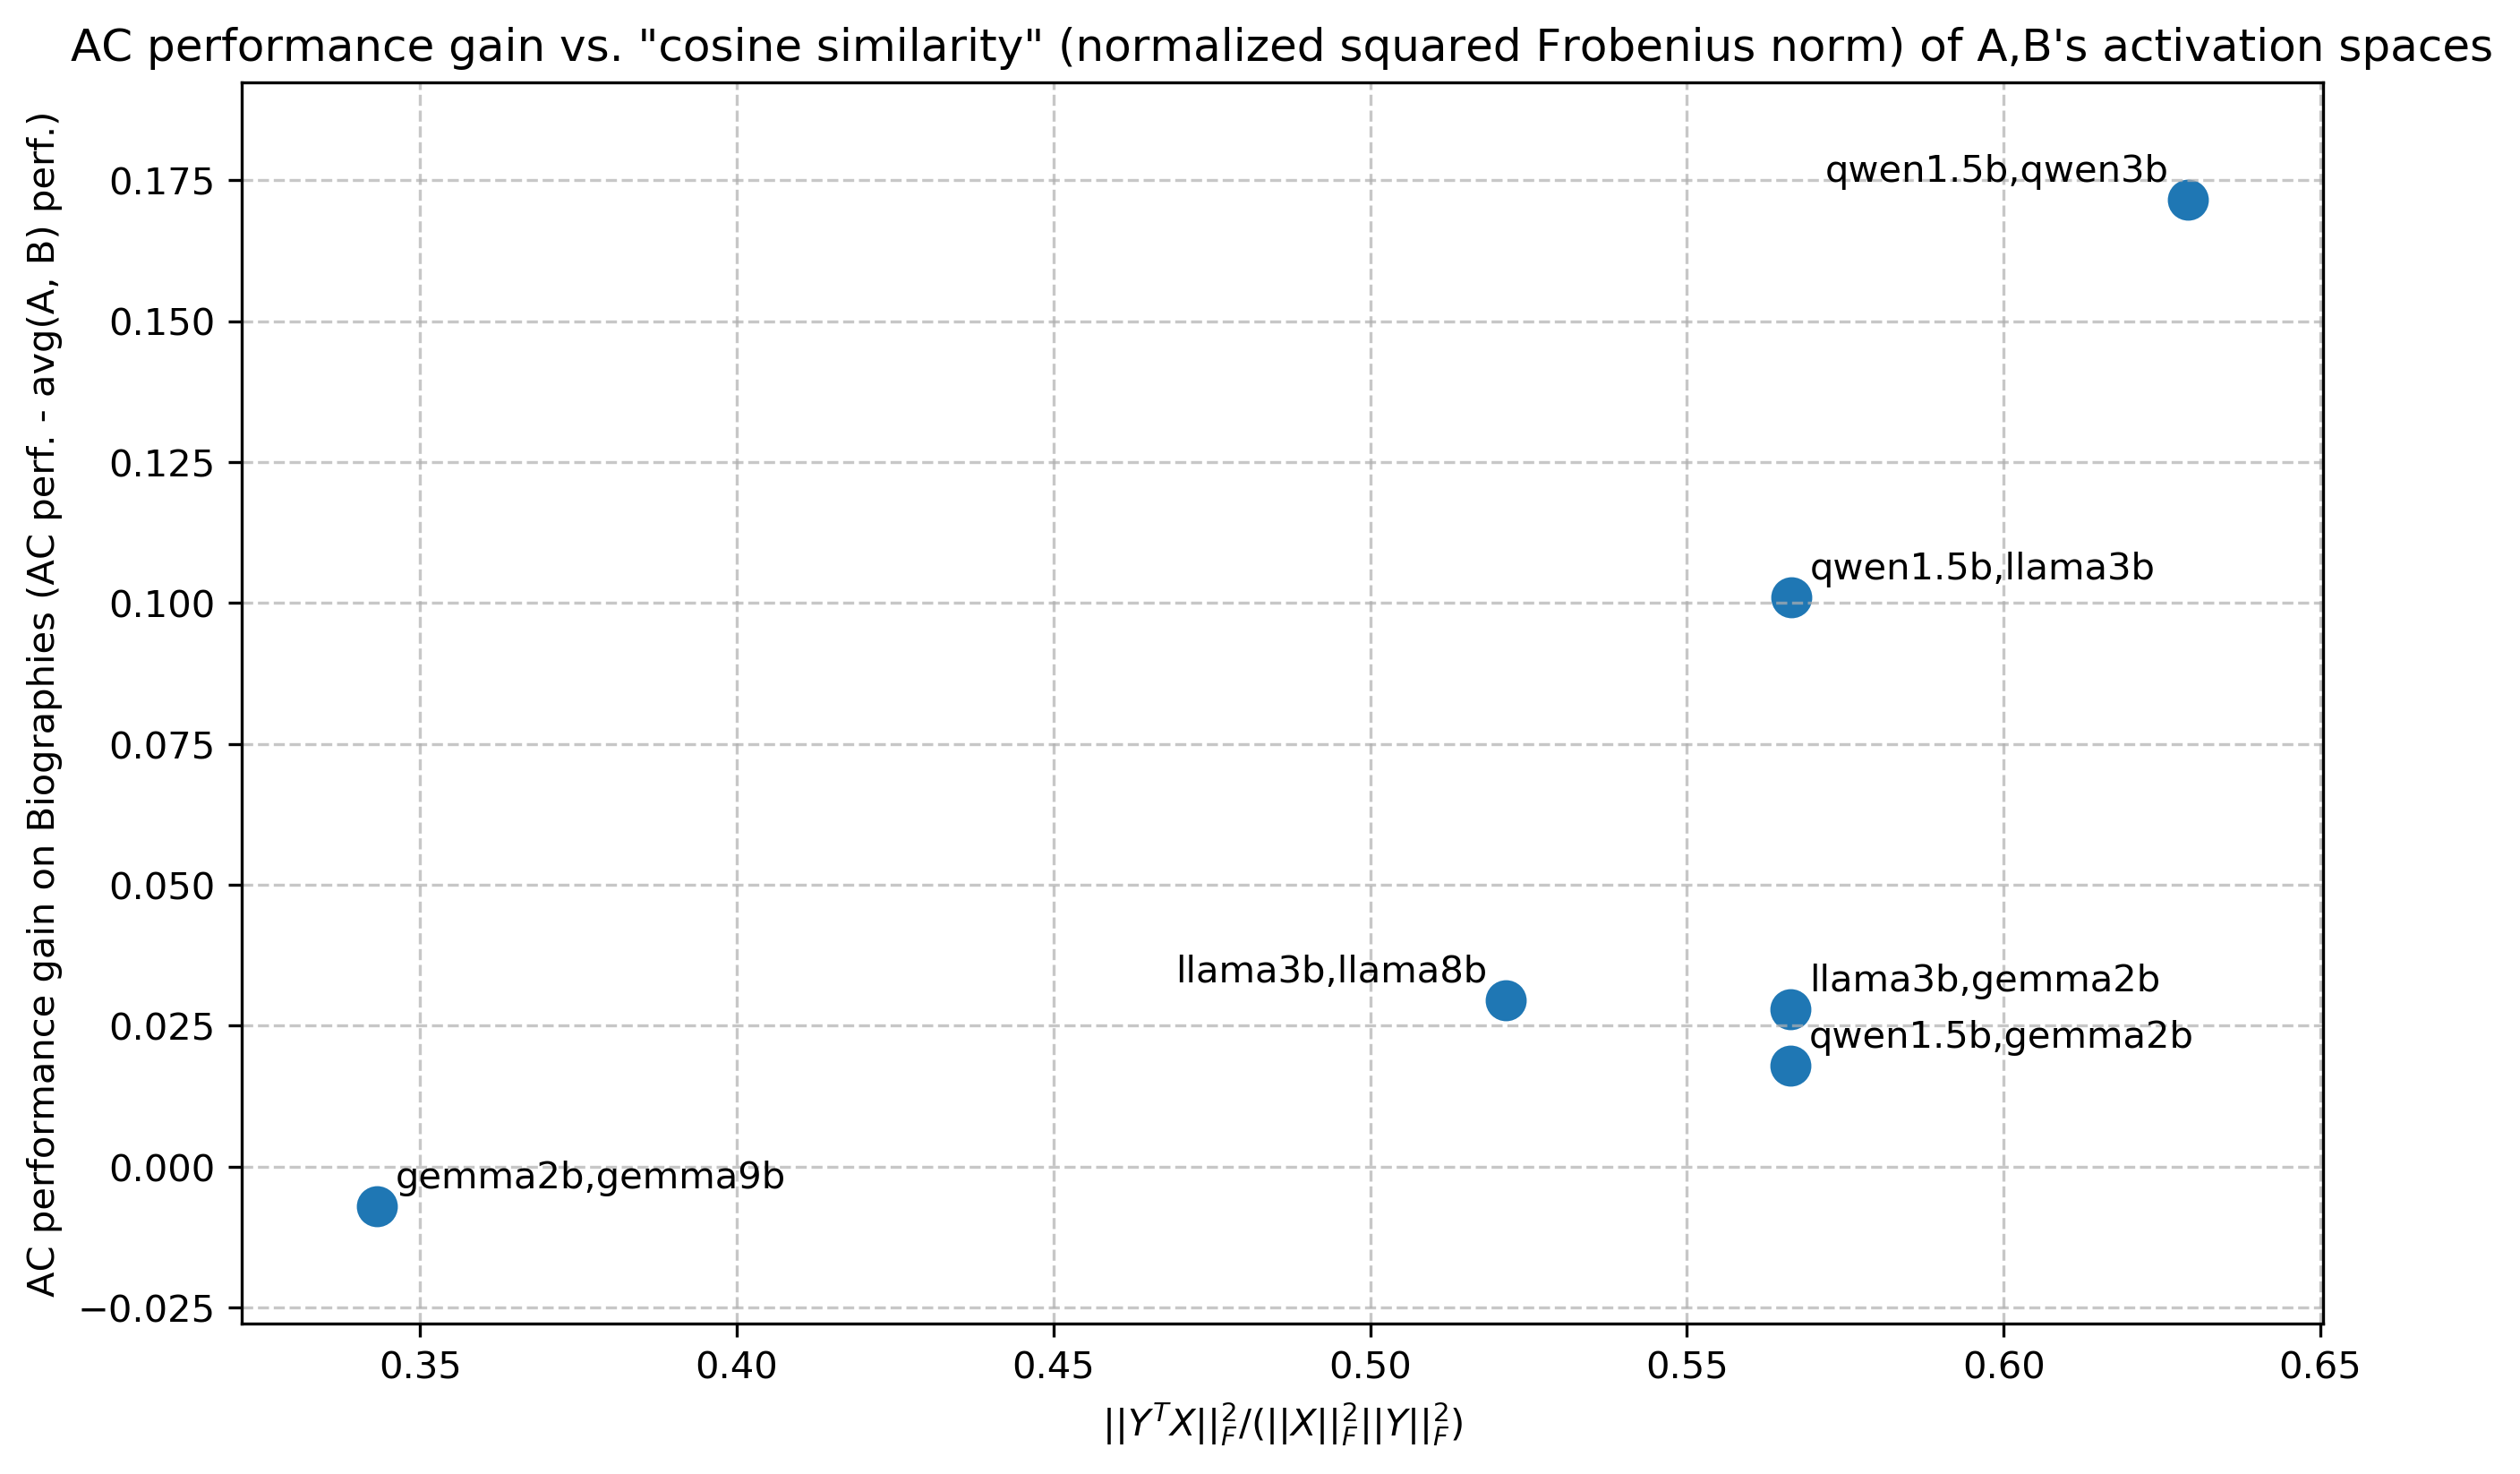
## Scatter Plot: AC Performance Gain vs. Activation Space Similarity
### Overview
This image is a scatter plot comparing the performance gain of an "AC" method against a measure of similarity between the activation spaces of pairs of language models. The plot contains six data points, each labeled with a pair of model names (e.g., "qwen1.5b,qwen3b"). The overall trend suggests a positive correlation: as the activation space similarity increases, the performance gain from AC also tends to increase.
### Components/Axes
* **Chart Title:** "AC performance gain vs. "cosine similarity" (normalized squared Frobenius norm) of A,B's activation spaces"
* **Y-Axis:**
* **Label:** "AC performance gain on Biographies (AC perf. - avg(A, B) perf.)"
* **Scale:** Linear, ranging from approximately -0.025 to 0.175. Major tick marks are at intervals of 0.025 (e.g., 0.000, 0.025, 0.050, ..., 0.175).
* **Interpretation:** This axis represents the improvement in performance on a "Biographies" task when using the AC method, calculated as the AC performance minus the average performance of the two individual models (A and B). A positive value indicates AC outperforms the average of the pair.
* **X-Axis:**
* **Label:** `||Y^T X||_F^2 / (||X||_F^2 ||Y||_F^2)`
* **Scale:** Linear, ranging from approximately 0.35 to 0.65. Major tick marks are at 0.35, 0.40, 0.45, 0.50, 0.55, 0.60, and 0.65.
* **Interpretation:** This is the mathematical formula for the "cosine similarity" metric referenced in the title. It is the normalized squared Frobenius norm of the product of the transposed activation matrix Y and activation matrix X. It quantifies the similarity between the activation spaces of model A (represented by X) and model B (represented by Y). A value closer to 1 indicates higher similarity.
* **Data Points:** Six blue circular markers, each annotated with a text label identifying a pair of models. There is no separate legend; labels are placed directly adjacent to their corresponding points.
* **Grid:** A light gray dashed grid is present for both major x and y ticks.
### Detailed Analysis
The following table reconstructs the data from the six labeled points. Values are approximate based on visual inspection of the plot.
| Data Point Label (Model Pair) | Approx. X-Value (Similarity) | Approx. Y-Value (AC Gain) | Spatial Position (Relative) |
| :--- | :--- | :--- | :--- |
| `qwen1.5b,qwen3b` | 0.63 | 0.17 | Top-right corner |
| `qwen1.5b,llama3b` | 0.57 | 0.10 | Upper-middle right |
| `llama3b,gemma2b` | 0.57 | 0.03 | Center-right, below the previous point |
| `qwen1.5b,gemma2b` | 0.57 | 0.02 | Center-right, just below `llama3b,gemma2b` |
| `llama3b,llama8b` | 0.52 | 0.03 | Center |
| `gemma2b,gemma9b` | 0.35 | -0.01 | Bottom-left corner |
**Trend Verification:**
* The data series does not form a line but shows a clear upward trend from left to right.
* The point with the lowest similarity (`gemma2b,gemma9b`, x≈0.35) has a slightly negative performance gain.
* The point with the highest similarity (`qwen1.5b,qwen3b`, x≈0.63) has the highest performance gain by a significant margin.
* Three points cluster around a similarity of 0.57, with performance gains ranging from 0.02 to 0.10.
### Key Observations
1. **Positive Correlation:** There is a strong visual suggestion that higher activation space similarity between two models is associated with a greater performance gain from the AC method.
2. **Highest Performing Pair:** The pair `qwen1.5b,qwen3b` is a clear outlier in terms of gain, achieving nearly double the gain of the next highest point (`qwen1.5b,llama3b`). This pair also exhibits the highest measured similarity.
3. **Negative Gain:** The pair `gemma2b,gemma9b` is the only one showing a negative AC gain (approx. -0.01), indicating the AC method performed slightly worse than the average of the two individual models for this pair. This pair also has the lowest similarity score.
4. **Clustering at Mid-Range Similarity:** Three data points (`qwen1.5b,llama3b`, `llama3b,gemma2b`, `qwen1.5b,gemma2b`) share a very similar x-value (~0.57) but show a wide spread in y-values (0.02 to 0.10). This indicates that while similarity is a strong factor, other model-pair characteristics also significantly influence the AC gain.
### Interpretation
The chart presents empirical evidence for a hypothesis in machine learning research: the effectiveness of a model merging or ensemble technique (here called "AC") is related to the representational similarity of the constituent models.
* **What the data suggests:** The positive trend implies that the AC method is most beneficial when applied to models whose internal activation spaces are already highly aligned (high cosine similarity). When models are dissimilar (low similarity), the method may offer little benefit or even be detrimental, as seen with the `gemma2b,gemma9b` pair.
* **Relationship between elements:** The x-axis (similarity) acts as the independent variable or predictor, while the y-axis (performance gain) is the dependent outcome. The plot tests how well the former predicts the latter.
* **Notable anomalies and insights:** The cluster at x≈0.57 is particularly interesting. It shows that for a given level of similarity, the gain can vary substantially. This suggests that similarity is a necessary but not sufficient condition for high gain. The specific nature of the model pair (e.g., architecture family, size difference) likely plays a crucial secondary role. For instance, `qwen1.5b,llama3b` (cross-family) yields a much higher gain than `llama3b,gemma2b` (also cross-family) at the same similarity level, hinting at other underlying factors.
* **Peircean investigative reading:** The chart is an indexical sign pointing to a causal relationship. The physical arrangement of points (their correlation) indexes an underlying principle about model compatibility. The symbolic labels (model names) allow us to hypothesize about *why* certain pairs are more compatible. For example, the high-performing `qwen1.5b,qwen3b` pair consists of two models from the same family (Qwen) at different scales, suggesting intra-family merging might be particularly effective with this AC method. Conversely, the negative-gain `gemma2b,gemma9b` pair is also intra-family (Gemma), indicating that family alone is not a guarantee of success; the specific similarity metric captured here is a more direct indicator.