## Scatter Plot: AC Performance Gain vs. Cosine Similarity
### Overview
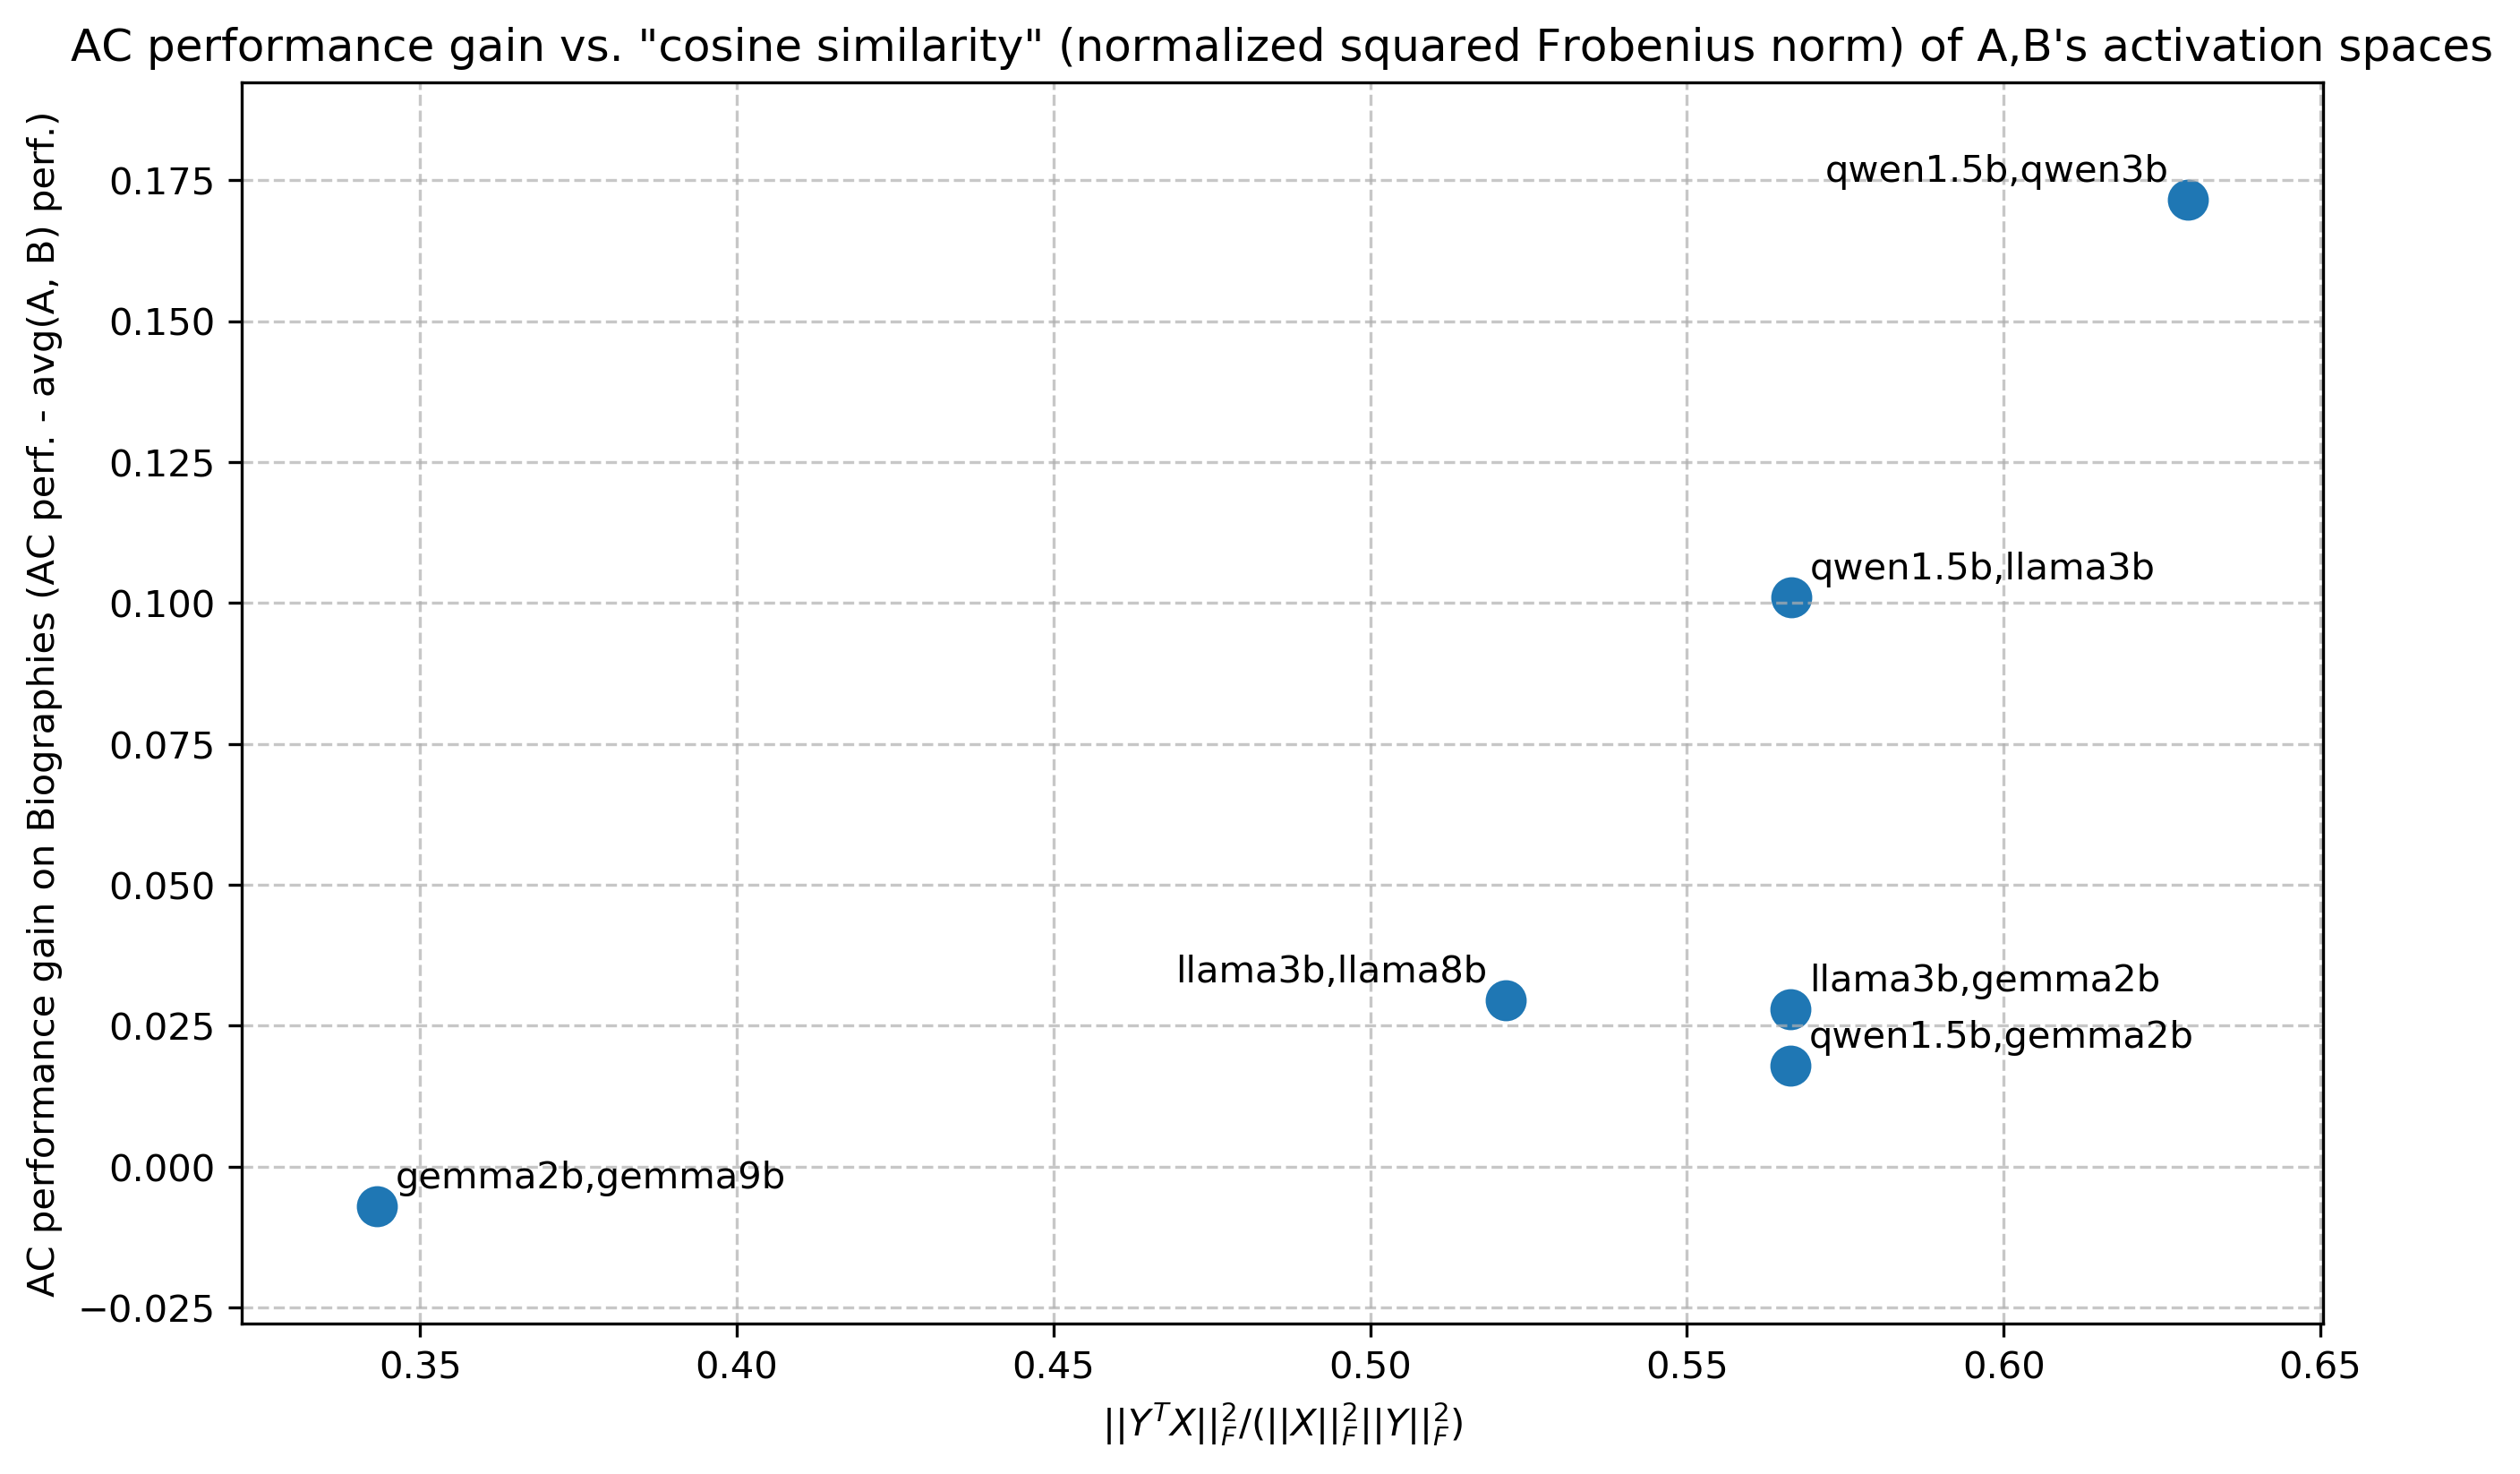
The image is a scatter plot showing the relationship between AC (Accuracy) performance gain on biographies and the cosine similarity (normalized squared Frobenius norm) of activation spaces A and B. Each point represents a different model configuration, labeled with the model names. The plot visualizes how the similarity of activation spaces correlates with the performance gain.
### Components/Axes
* **Title:** AC performance gain vs. "cosine similarity" (normalized squared Frobenius norm) of A, B's activation spaces
* **X-axis:** ||Y^T X||_F^2 / (||X||_F^2 ||Y||_F^2) - Represents the cosine similarity between activation spaces. The scale ranges from approximately 0.35 to 0.65, with tick marks at intervals of 0.05.
* **Y-axis:** AC performance gain on Biographies (AC perf. - avg(A, B) perf.) - Represents the gain in AC performance. The scale ranges from -0.025 to 0.175, with tick marks at intervals of 0.025.
* **Data Points:** Each data point is a blue circle, labeled with the corresponding model names.
### Detailed Analysis
The data points, from left to right, are approximately:
* **gemma2b,gemma9b:** X: 0.34, Y: -0.01
* **llama3b,llama8b:** X: 0.51, Y: 0.03
* **llama3b,gemma2b:** X: 0.57, Y: 0.02
* **qwen1.5b,gemma2b:** X: 0.57, Y: 0.02
* **qwen1.5b,llama3b:** X: 0.57, Y: 0.10
* **qwen1.5b,qwen3b:** X: 0.63, Y: 0.17
### Key Observations
* There appears to be a positive correlation between cosine similarity and AC performance gain. As the cosine similarity increases, the AC performance gain tends to increase as well.
* The models "llama3b,gemma2b" and "qwen1.5b,gemma2b" have similar cosine similarity and AC performance gain values, clustering together.
* The model "gemma2b,gemma9b" has the lowest cosine similarity and the lowest AC performance gain.
* The model "qwen1.5b,qwen3b" has the highest cosine similarity and the highest AC performance gain.
### Interpretation
The scatter plot suggests that a higher cosine similarity between the activation spaces of models A and B is associated with a greater AC performance gain on biographies. This could indicate that models with more similar internal representations tend to perform better in this specific task. The clustering of certain models suggests that specific model combinations yield similar performance characteristics. The outlier "gemma2b,gemma9b" indicates that this model combination may have significantly different internal representations or is less effective for the biography task.