\n
## Scatter Plot: AC Performance Gain vs. Cosine Similarity
### Overview
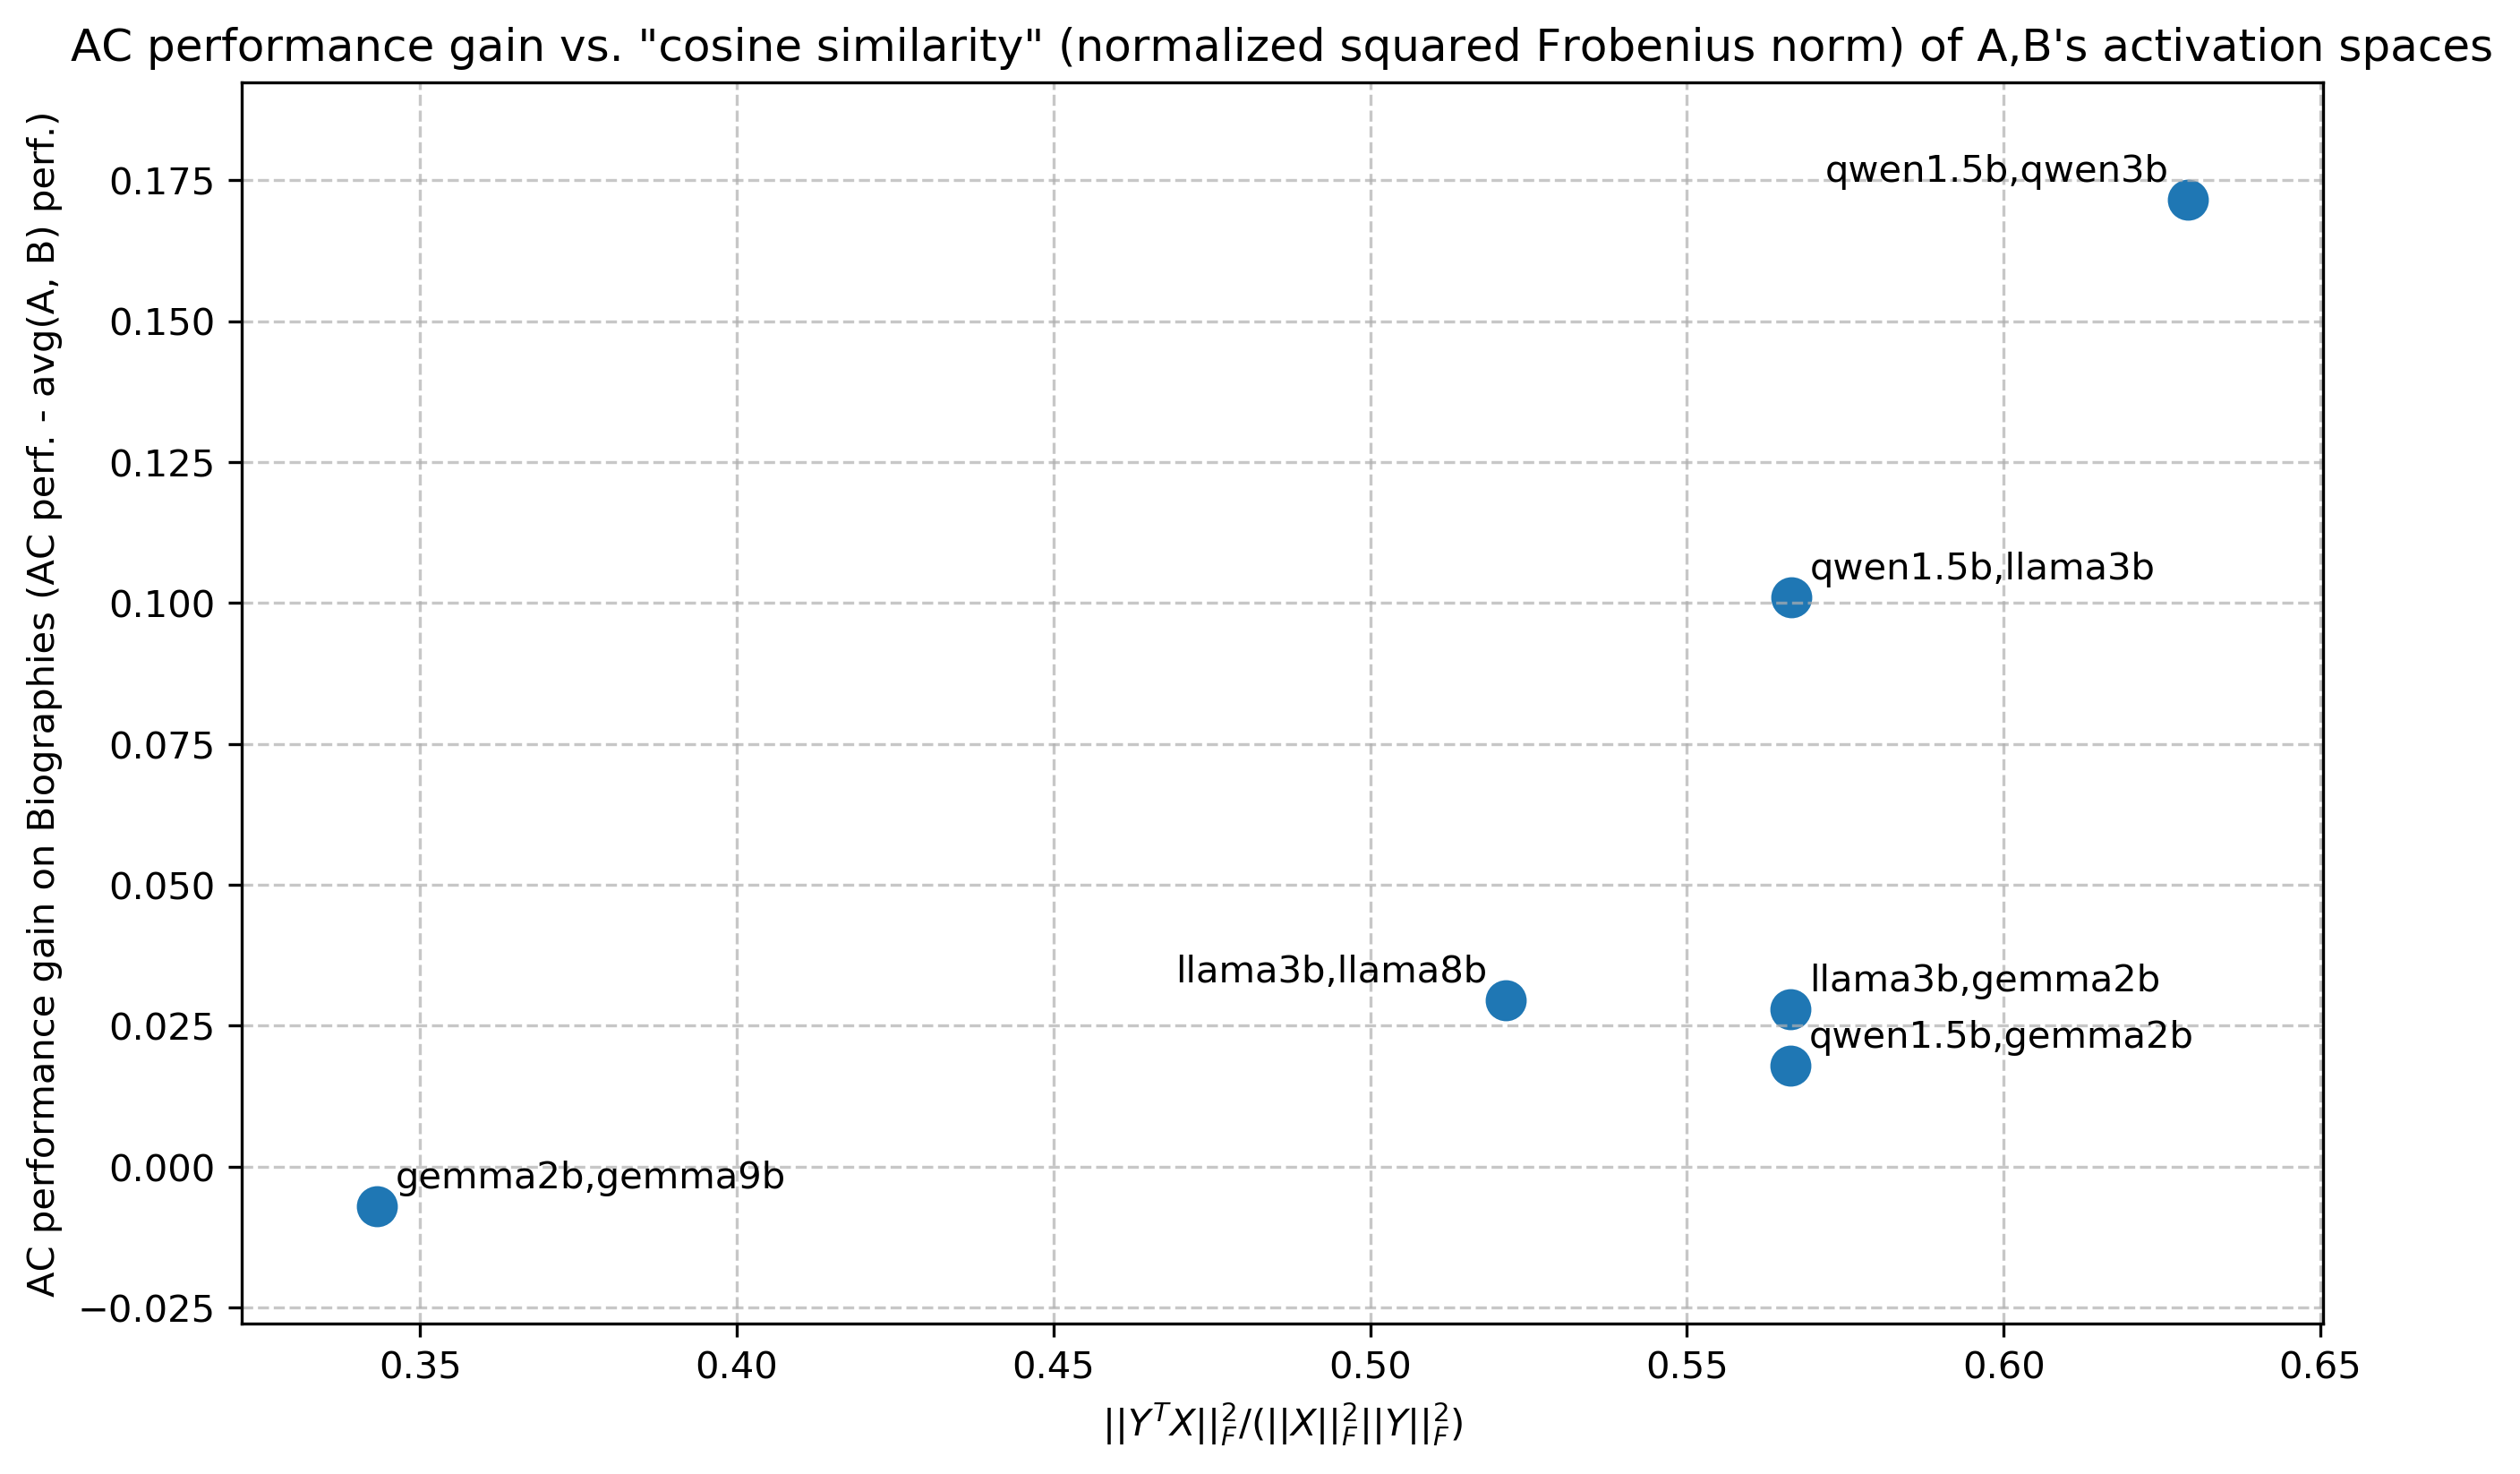
This image presents a scatter plot visualizing the relationship between AC (Accuracy Consistency) performance gain on Biographies and a normalized squared Frobenius norm representing the cosine similarity of activation spaces between models. Each point on the plot represents a pair of models.
### Components/Axes
* **X-axis Title:** ||X<sup>T</sup>X||/||X||<sup>2</sup>||Y||<sup>2</sup> (Represents the normalized squared Frobenius norm)
* Scale: Approximately 0.3 to 0.65
* **Y-axis Title:** AC performance gain on Biographies (AC perf. - avg(A, B) perf.)
* Scale: Approximately -0.025 to 0.175
* **Data Points:** Each point is labeled with a pair of model names.
* **No Legend:** The model pairs are directly labeled on the plot.
### Detailed Analysis
The scatter plot displays the following data points (model pairs) and their approximate coordinates:
1. **gemma2b,gemma9b:** (0.35, -0.015) - Located in the bottom-left corner of the plot.
2. **qwen1.5b,llama3b:** (0.55, 0.10) - Located in the upper-middle of the plot.
3. **llama3b,llama8b:** (0.5, 0.025) - Located in the lower-middle of the plot.
4. **llama3b,gemma2b:** (0.58, 0.025) - Located in the lower-middle of the plot, slightly to the right of the previous point.
5. **qwen1.5b,gemma2b:** (0.6, 0.025) - Located in the lower-middle of the plot, slightly to the right of the previous point.
6. **qwen1.5b,qwen3b:** (0.65, 0.17) - Located in the top-right corner of the plot.
**Trends:**
* There is a general upward trend, suggesting that as the normalized squared Frobenius norm increases, the AC performance gain on Biographies also tends to increase. However, this trend is not strictly linear, and there is considerable scatter.
* The points are not clustered, indicating a wide range of performance gains for different model pairs at similar cosine similarity values.
### Key Observations
* The model pair `qwen1.5b,qwen3b` exhibits the highest AC performance gain on Biographies (approximately 0.17) and the highest normalized squared Frobenius norm (approximately 0.65).
* The model pair `gemma2b,gemma9b` exhibits the lowest AC performance gain on Biographies (approximately -0.015) and the lowest normalized squared Frobenius norm (approximately 0.35).
* Several model pairs (llama3b,gemma2b, qwen1.5b,gemma2b) have similar values for both the x and y axes, clustering around (0.58-0.6, 0.025).
### Interpretation
The plot suggests a correlation between the cosine similarity of activation spaces and the AC performance gain on Biographies. Higher cosine similarity (as measured by the normalized squared Frobenius norm) appears to be associated with higher AC performance gains. However, the scatter in the data indicates that cosine similarity is not the sole determinant of AC performance. Other factors, such as model architecture, training data, and hyperparameters, likely play a significant role.
The negative AC performance gain for the `gemma2b,gemma9b` pair suggests that combining or comparing these models might lead to a decrease in accuracy consistency on Biographies. This could be due to differences in how these models represent biographical information in their activation spaces.
The clustering of points around similar values suggests that certain model combinations exhibit similar performance characteristics. Further investigation could explore the reasons for this clustering and identify the underlying factors that contribute to it. The plot provides a visual representation of the relationship between activation space similarity and performance, which can be useful for understanding and improving model behavior.