## Diagram: World Languages Distribution
### Overview
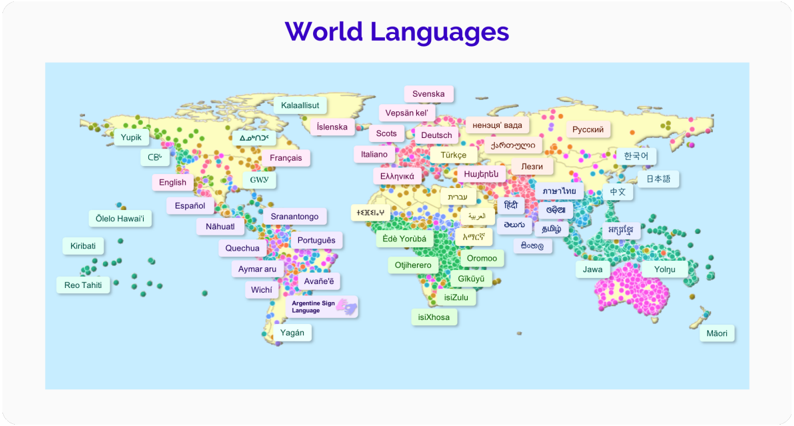
The image is a world map titled "World Languages," depicting the geographic distribution of major languages using color-coded dots. Each dot represents a language, with labels placed near regions where the language is spoken. A legend on the right correlates colors to specific languages. The map emphasizes linguistic diversity, with clusters of languages concentrated in specific regions.
### Components/Axes
- **Map**:
- Geographic regions (continents, countries) labeled with language names (e.g., "English," "Spanish," "Mandarin").
- Dots in distinct colors represent languages, with sizes varying slightly (no explicit scale provided).
- **Legend**:
- Located on the right side of the map.
- Lists languages with corresponding colors (e.g., English = pink, Spanish = red, Mandarin = blue).
- Includes languages like Arabic, Hindi, Swahili, and indigenous languages (e.g., Yolngu, Māori).
### Detailed Analysis
- **Languages and Colors**:
- **English**: Pink dots, widespread across North America, Europe, Oceania, and parts of Africa.
- **Spanish**: Red dots, concentrated in South America and parts of North America.
- **Mandarin**: Blue dots, dominant in East Asia (China, Taiwan).
- **Arabic**: Dark blue dots, concentrated in North Africa and the Middle East.
- **Hindi**: Orange dots, clustered in South Asia (India, Pakistan).
- **Swahili**: Green dots, spread across East Africa.
- **Japanese**: Purple dots, concentrated in Japan.
- **Indigenous Languages**: Smaller dots (e.g., Yolngu = magenta in Australia, Māori = light blue in New Zealand).
- **Regional Patterns**:
- **Europe**: Multiple languages (English, French, German, Russian) with overlapping dots.
- **Africa**: High diversity, with Swahili, Arabic, and indigenous languages (e.g., Yoruba, Zulu).
- **Asia**: Mandarin, Hindi, Japanese, and Korean dominate, with smaller clusters of other languages.
- **Oceania**: English (Australia) and indigenous languages (Yolngu, Māori).
- **Caribbean**: Spanish, Haitian Creole, and French dominate.
- **Notable Clusters**:
- **India**: Hindi, Tamil, Telugu, and Bengali dots overlap.
- **Southeast Asia**: Vietnamese, Thai, and Indonesian dots are prominent.
- **Middle East**: Arabic and Persian (dark blue) dominate.
### Key Observations
1. **Colonial Influence**: English, Spanish, and French are prevalent in former colonies (e.g., Americas, Africa).
2. **Indigenous Languages**: Smaller clusters (e.g., Yolngu, Māori) indicate linguistic diversity but lower global prevalence.
3. **Multilingual Regions**: India, Africa, and the Caribbean show overlapping languages, reflecting cultural and historical complexity.
4. **Language Dominance**: Mandarin, English, and Spanish have the largest geographic footprints.
### Interpretation
The map highlights the interplay of colonialism, globalization, and indigenous heritage in shaping language distribution. English, Spanish, and French dominate due to historical colonial expansion, while Mandarin reflects China's demographic and economic influence. Indigenous languages, though geographically limited, underscore cultural preservation efforts. The clustering of languages in regions like India and Africa suggests multilingualism as a norm, contrasting with more monolingual areas like Japan or Scandinavia. The absence of a scale for dot size leaves uncertainty about language speaker populations, but the visual emphasis on clusters implies regional linguistic dominance. This map serves as a tool for understanding geopolitical and cultural ties through language.