## Line Chart: Llama-3.1-8B-Instruct Performance vs. Compression Ratio
### Overview
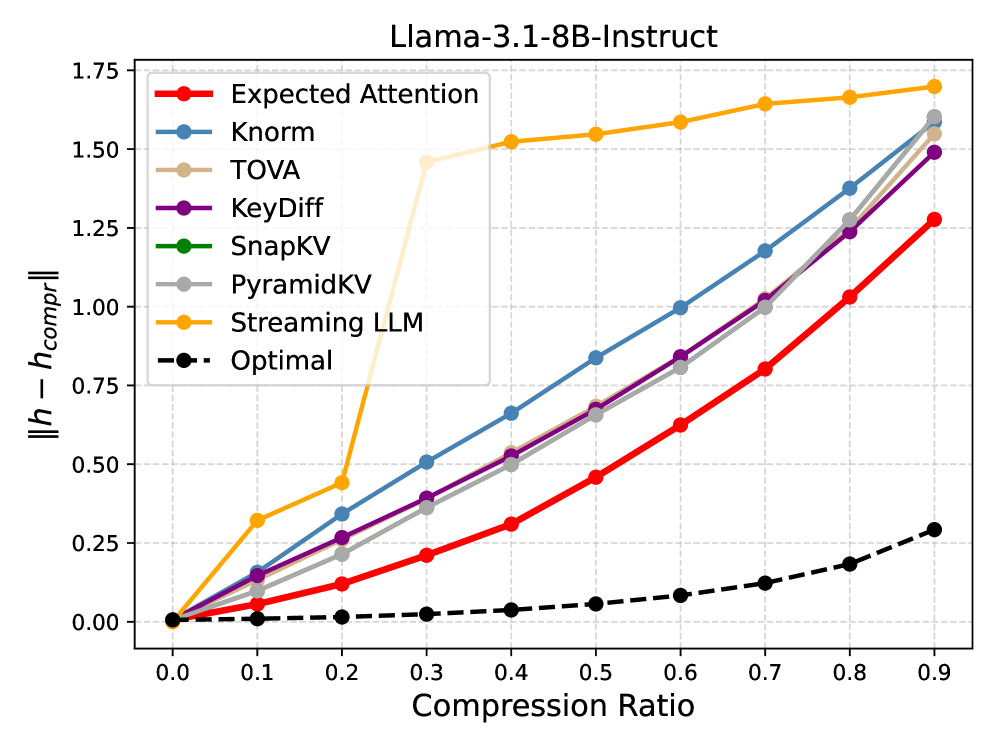
This line chart compares the performance deviation (||h - h_compr||) of various compression methods for the Llama-3.1-8B-Instruct model across different compression ratios (0.0 to 0.9). The y-axis represents the magnitude of performance loss relative to an "Optimal" baseline, while the x-axis shows the compression ratio applied.
### Components/Axes
- **X-axis (Compression Ratio)**: Ranges from 0.0 to 0.9 in increments of 0.1.
- **Y-axis (||h - h_compr||)**: Performance deviation metric, ranging from 0.0 to 1.75.
- **Legend**: Located in the top-right corner, with the following methods and colors:
- Red: Expected Attention
- Blue: Knorm
- Beige: TOVA
- Purple: KeyDiff
- Green: SnapKV
- Gray: PyramidKV
- Orange: Streaming LLM
- Black dashed: Optimal
### Detailed Analysis
1. **Expected Attention (Red)**: Starts at 0.0 and increases steadily, reaching ~1.25 at 0.9 compression.
2. **Knorm (Blue)**: Begins slightly above 0.0, rising sharply to ~1.6 at 0.9.
3. **TOVA (Beige)**: Sharp initial rise, plateauing near 1.5 by 0.3 compression, then stabilizing.
4. **KeyDiff (Purple)**: Similar to Knorm but slightly lower, reaching ~1.5 at 0.9.
5. **SnapKV (Green)**: Remains flat at ~0.0 across all compression ratios.
6. **PyramidKV (Gray)**: Gradual increase from 0.0 to ~1.6 at 0.9.
7. **Streaming LLM (Orange)**: Sharp rise to ~1.5 by 0.2 compression, then plateaus.
8. **Optimal (Black dashed)**: Flat line at 0.0, serving as the baseline.
### Key Observations
- **Highest Deviation**: Knorm and Streaming LLM exhibit the largest performance loss, especially at higher compression ratios.
- **Lowest Deviation**: SnapKV maintains near-zero deviation, indicating minimal performance loss.
- **Consistent Trends**: Most methods (except SnapKV) show increasing deviation as compression ratio rises.
- **Anomalies**: TOVA and Streaming LLM plateau early, suggesting diminishing returns after initial compression.
### Interpretation
The chart demonstrates that compression methods like Knorm and Streaming LLM significantly degrade performance as compression intensifies, while SnapKV preserves performance effectively. The "Optimal" baseline (0.0) highlights the ideal scenario where no performance loss occurs. Methods like TOVA and KeyDiff balance compression and performance better than others but still lag behind SnapKV. The sharp initial rises in Knorm and Streaming LLM suggest they are particularly sensitive to compression, making them less suitable for high-compression scenarios. This analysis underscores the trade-off between compression efficiency and model performance, with SnapKV emerging as the most robust method in this context.