## Scatter Plot: High School Mathematics Confidence vs. Target Length
### Overview
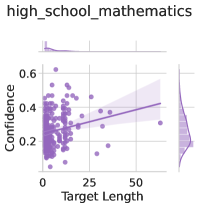
The image is a scatter plot showing the relationship between "Confidence" and "Target Length" in the context of high school mathematics. The plot includes marginal distributions (histograms) for both variables. A regression line with a confidence interval is overlaid on the scatter plot.
### Components/Axes
* **Title:** high\_school\_mathematics
* **X-axis:** Target Length
* Scale ranges from 0 to 50, with tick marks at approximately 0, 25, and 50.
* **Y-axis:** Confidence
* Scale ranges from 0.0 to 0.6, with tick marks at 0.0, 0.2, 0.4, and 0.6.
* **Data Points:** Each point represents a data entry, with the x-coordinate indicating the "Target Length" and the y-coordinate indicating the "Confidence". The points are colored in a light purple.
* **Regression Line:** A light purple line shows the linear regression fit to the data.
* **Confidence Interval:** A shaded light purple region around the regression line represents the confidence interval.
* **Marginal Distributions:**
* Top: A histogram showing the distribution of "Target Length".
* Right: A histogram showing the distribution of "Confidence".
### Detailed Analysis
* **Target Length Distribution:** The histogram at the top shows that most data points have a "Target Length" between 0 and 25.
* **Confidence Distribution:** The histogram on the right shows that most data points have a "Confidence" between 0.2 and 0.5.
* **Scatter Plot:** The scatter plot shows a slight positive correlation between "Target Length" and "Confidence". As "Target Length" increases, "Confidence" tends to increase as well, but the relationship is weak.
* **Regression Line:** The regression line confirms the slight positive correlation.
* **Confidence Interval:** The confidence interval is relatively wide, indicating a high degree of uncertainty in the regression line.
### Key Observations
* The majority of data points are clustered at lower "Target Length" values.
* There is a wide range of "Confidence" values for any given "Target Length".
* The positive correlation between "Target Length" and "Confidence" is weak.
### Interpretation
The data suggests that there is a slight positive relationship between the length of the target and the confidence level in high school mathematics. However, the relationship is weak, and there is a lot of variability in the data. This could mean that other factors, such as the difficulty of the problem or the student's prior knowledge, have a greater impact on confidence than the target length. The wide confidence interval suggests that the relationship may not be statistically significant.