## Scatter Plot with Regression Line: High School Mathematics Confidence vs. Target Length
### Overview
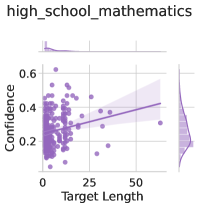
The image is a scatter plot chart titled "high_school_mathematics". It visualizes the relationship between "Target Length" (x-axis) and "Confidence" (y-axis) for a set of data points. A linear regression trend line with a shaded confidence interval is overlaid on the data.
### Components/Axes
* **Title:** `high_school_mathematics` (positioned at the top center).
* **Y-Axis:**
* **Label:** `Confidence` (positioned vertically along the left side).
* **Scale:** Linear scale ranging from 0.0 to 0.6.
* **Major Tick Marks:** 0.0, 0.2, 0.4, 0.6.
* **X-Axis:**
* **Label:** `Target Length` (positioned horizontally at the bottom).
* **Scale:** Linear scale ranging from 0 to 50.
* **Major Tick Marks:** 0, 25, 50.
* **Data Series:**
* **Scatter Points:** Numerous individual data points represented as small, solid purple circles.
* **Trend Line:** A solid purple line representing a linear regression fit to the data.
* **Confidence Interval:** A semi-transparent, light purple shaded region surrounding the trend line, indicating the uncertainty or confidence band of the regression.
* **Legend/Key:** There is no separate legend box. The y-axis label "Confidence" also serves as the identifier for the data series, which is consistent with the purple color of the points and line.
### Detailed Analysis
* **Data Distribution:** The data points are densely clustered in the lower-left quadrant of the plot, specifically where `Target Length` is between approximately 0 and 20, and `Confidence` is between 0.0 and 0.4. The density of points decreases significantly as `Target Length` increases beyond 25.
* **Trend Line:** The purple regression line has a clear positive slope. It originates near a `Confidence` value of ~0.25 at `Target Length` 0 and rises to approximately 0.45 at `Target Length` 50.
* **Confidence Interval:** The shaded confidence band is narrowest near the center of the data mass (around `Target Length` 10-15) and widens considerably towards the right edge of the plot (`Target Length` > 40), indicating greater uncertainty in the trend prediction where data is sparse.
* **Outliers:** A few data points exist with relatively high `Confidence` (>0.5) at low `Target Length` (<10). Conversely, there are points with very low `Confidence` (<0.1) scattered across the `Target Length` range.
### Key Observations
1. **Positive Correlation:** There is a visible positive correlation between `Target Length` and `Confidence`. As the target length increases, the confidence score generally tends to increase.
2. **Heteroscedasticity:** The variance (spread) of the `Confidence` values appears greater at lower `Target Length` values. The data is more tightly clustered around the trend line at higher `Target Length` values, though this is influenced by the smaller number of data points there.
3. **Data Sparsity:** The dataset is heavily skewed towards shorter target lengths. Very few observations exist for `Target Length` values greater than 30.
4. **Uncertainty Visualization:** The widening confidence interval band explicitly communicates that the model's estimate of the relationship becomes less reliable as we move into the region of sparse data (high target length).
### Interpretation
The chart suggests that in the context of "high_school_mathematics," tasks or items with longer target lengths (which could refer to the length of a problem, solution, or text passage) are associated with higher measured confidence. This could imply several underlying phenomena:
* **Complexity vs. Confidence:** Longer problems might be perceived as more complex, and the confidence metric might be capturing a different dimension than pure accuracy—perhaps self-assurance or the richness of the response.
* **Metric Behavior:** The "Confidence" metric itself may be inherently biased or scaled in a way that correlates with output length.
* **Data Collection Bias:** The sparse data at high target lengths means the observed positive trend is driven primarily by the dense cluster of short-length items. The relationship for longer lengths is an extrapolation with high uncertainty, as shown by the wide confidence band. Any conclusions about very long targets (e.g., >40) are speculative based on this visualization.
**In summary, the data demonstrates a moderate positive linear relationship between target length and confidence, but this relationship is most reliably observed for shorter targets, and the predictive power diminishes significantly for longer ones.**