## Scatter Plot: High School Mathematics Confidence vs. Target Length
### Overview
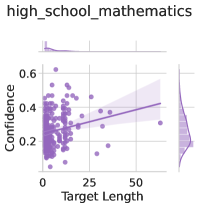
The image is a scatter plot titled "high_school_mathematics" depicting the relationship between "Target Length" (x-axis) and "Confidence" (y-axis). A linear trend line with a shaded confidence interval is overlaid on the data points. Two histograms are embedded: one at the top (Target Length distribution) and one on the right (Confidence distribution). The data points are purple, and the trend line is a solid purple line with a shaded purple region.
---
### Components/Axes
- **X-axis (Target Length)**: Labeled "Target Length" with values ranging from 0 to 50. The axis is linear, with ticks at 0, 10, 20, 30, 40, 50.
- **Y-axis (Confidence)**: Labeled "Confidence" with values ranging from 0 to 0.6. The axis is linear, with ticks at 0, 0.2, 0.4, 0.6.
- **Legend**: No explicit legend is visible, but the trend line and shaded area are implied to represent the central tendency and confidence interval, respectively.
- **Histograms**:
- **Top Histogram (Target Length)**: Shows a distribution of Target Length values, with a peak around 25–30.
- **Right Histogram (Confidence)**: Shows a distribution of Confidence values, with a peak around 0.3–0.4.
---
### Detailed Analysis
- **Data Points**:
- Approximately 50–60 purple dots are scattered across the plot.
- Most points cluster near the trend line, with some outliers below and above it.
- The shaded confidence interval (purple) spans roughly ±0.15 around the trend line, indicating variability in Confidence for a given Target Length.
- **Trend Line**:
- The line slopes upward, suggesting a positive correlation between Target Length and Confidence.
- The equation of the line is not explicitly provided, but the slope appears moderate (e.g., ~0.01–0.02 per unit Target Length).
- **Histograms**:
- **Target Length**: The top histogram shows a unimodal distribution with a peak at ~25–30. The distribution tapers off toward 0 and 50.
- **Confidence**: The right histogram shows a bimodal distribution, with peaks near 0.3 and 0.4, and a smaller peak near 0.2.
---
### Key Observations
1. **Positive Correlation**: The upward trend line indicates that longer Target Lengths are associated with higher Confidence.
2. **Confidence Interval**: The shaded area suggests that Confidence values vary by ~0.15 for a given Target Length, indicating uncertainty in the relationship.
3. **Distribution Peaks**:
- Target Length peaks at ~25–30, suggesting this is the most common range.
- Confidence peaks at ~0.3–0.4, indicating this is the most frequent Confidence level.
4. **Outliers**: A few data points fall outside the shaded confidence interval, particularly at lower Target Lengths (e.g., <10) and higher Confidence values (>0.5).
---
### Interpretation
The plot suggests that in high school mathematics, students with longer Target Lengths (e.g., more complex problems or extended tasks) tend to report higher Confidence. However, the shaded confidence interval highlights that this relationship is not perfectly deterministic—there is significant variability. The bimodal Confidence distribution implies that students often report either moderate (0.3–0.4) or slightly lower (0.2) Confidence levels, with fewer instances of very high or very low Confidence. The histograms further reveal that Target Lengths are most frequently in the mid-range (25–30), which may reflect typical problem difficulty or task duration in high school settings. The absence of a legend leaves the exact meaning of the shaded area ambiguous, but its proximity to the trend line strongly suggests it represents the confidence interval.