## Gantt Chart: Project Timeline Visualization
### Overview
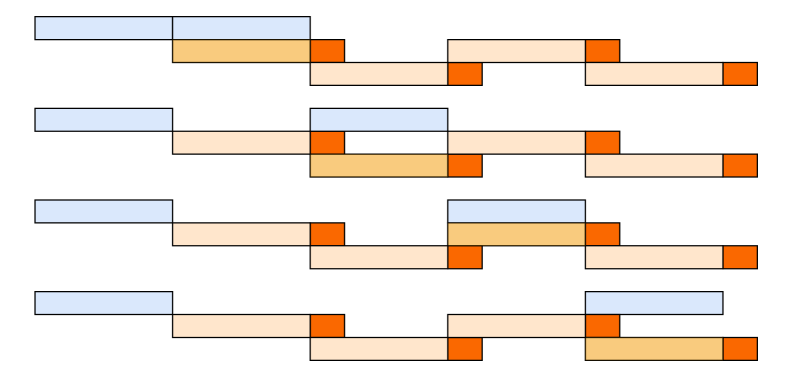
The image is a simplified Gantt chart displaying four project timelines. Each timeline consists of rectangular blocks representing tasks, with different colors indicating task status or category. The chart lacks explicit axes or labels, so the interpretation relies on the relative positioning and color-coding of the blocks.
### Components/Axes
* **Tasks:** Represented by rectangular blocks.
* **Timeline:** Each horizontal row represents a project timeline.
* **Colors:**
* Light Blue: Represents the initial phase of a task.
* Light Orange: Represents the intermediate phase of a task.
* Dark Orange: Represents the final phase or a milestone.
* **Progression:** The progression of a task is visualized from left to right, with color changes indicating different stages.
### Detailed Analysis
Each of the four timelines follows a similar pattern, but with variations in the duration and sequence of tasks.
* **Timeline 1 (Top):** Starts with a light blue block, followed by a light orange block, a dark orange block, another light orange block, and ends with a dark orange block.
* **Timeline 2:** Starts with a light blue block, followed by a light orange block, a dark orange block, another light orange block, and ends with a dark orange block.
* **Timeline 3:** Starts with a light blue block, followed by a light orange block, a dark orange block, another light orange block, and ends with a dark orange block.
* **Timeline 4:** Starts with a light blue block, followed by a light orange block, a dark orange block, another light orange block, and ends with a dark orange block.
The length of each block represents the duration of the task. The dark orange blocks appear to represent milestones or critical points in the timeline.
### Key Observations
* All four timelines have a similar structure, suggesting a standardized project management approach.
* The variations in block lengths indicate differences in task durations across the projects.
* The dark orange blocks consistently mark the end of a task segment, likely representing key milestones.
### Interpretation
The Gantt chart visualizes the progression of four projects, highlighting the different phases and milestones involved. The consistent structure across the timelines suggests a standardized project management process. The variations in task durations indicate that while the overall structure is similar, the specific tasks and their durations differ across projects. The dark orange blocks serve as visual cues for critical milestones, allowing for easy tracking of project progress. The absence of explicit time scales or labels limits the ability to extract precise durations or dates, but the relative positioning and color-coding provide a clear overview of the project timelines.