## Chart/Diagram Type: Horizontal Bar Charts
### Overview
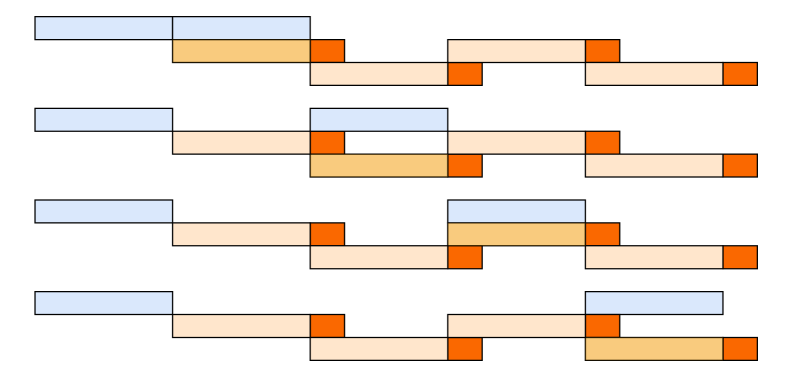
The image contains four horizontal bar charts arranged vertically. Each chart has four bars of varying lengths, colored in blue, orange, light orange, and yellow. No textual labels, axis titles, legends, or numerical values are visible. The charts share a consistent structure but differ in bar lengths, suggesting comparative data across categories.
### Components/Axes
- **Legend**: Located in the top-left corner of the image, but no labels or color mappings are visible.
- **Bars**: Four bars per chart, with colors:
- Blue (leftmost)
- Orange (second from left)
- Light orange (third from left)
- Yellow (rightmost)
- **Axes**: No axis titles, scales, or markers are present. The horizontal axis (implied by bar orientation) lacks numerical or categorical labels.
### Detailed Analysis
- **Bar Lengths**:
- **Chart 1 (Top)**: Blue (longest), orange (medium), light orange (short), yellow (shortest).
- **Chart 2 (Second from top)**: Blue (medium), orange (longest), light orange (medium), yellow (short).
- **Chart 3 (Third from top)**: Blue (short), orange (medium), light orange (longest), yellow (medium).
- **Chart 4 (Bottom)**: Blue (short), orange (medium), light orange (short), yellow (longest).
- **Color Consistency**: Colors are uniform across all charts, but their relative lengths vary.
### Key Observations
1. **No Textual Data**: No labels, legends, or numerical values are present to contextualize the data.
2. **Color-Coded Categories**: The four colors likely represent distinct categories or variables, but their meanings are undefined.
3. **Variable Bar Lengths**: The varying lengths suggest differences in magnitude or frequency, but without axis labels, the exact nature of the data remains unclear.
### Interpretation
- **Structure**: The consistent use of four colors across all charts implies a standardized comparison framework, possibly across time, groups, or metrics.
- **Uncertainty**: Without axis labels or legends, the data’s purpose (e.g., sales, performance, demographics) cannot be determined.
- **Potential Trends**:
- In Chart 1, the blue bar (longest) might indicate the highest value in its category.
- In Chart 4, the yellow bar (longest) could represent a peak or maximum.
- **Anomalies**: The absence of textual context introduces ambiguity. For example, the yellow bar’s position as the longest in Chart 4 contrasts with its shorter length in other charts, but this could reflect intentional design or data variability.
### Conclusion
The image depicts four horizontal bar charts with color-coded categories but lacks critical textual information (labels, legends, axis titles). While the structure suggests comparative analysis, the absence of explicit data points or context limits interpretability. Further clarification is required to assign meaning to the color-coded bars and their lengths.