## Line Chart: BLEU Score vs. Noise Level
### Overview
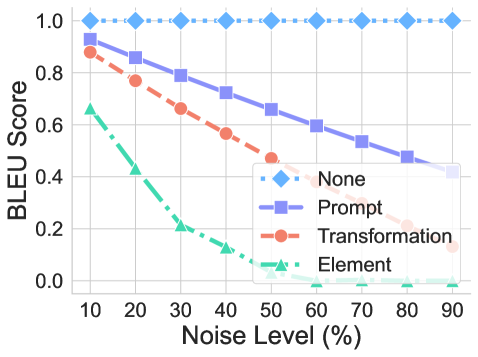
The image is a line chart comparing the BLEU (Bilingual Evaluation Understudy) score against the noise level (in percentage) for four different conditions: "None", "Prompt", "Transformation", and "Element". The chart illustrates how the BLEU score changes as the noise level increases for each condition.
### Components/Axes
* **X-axis:** Noise Level (%), with markers at 10, 20, 30, 40, 50, 60, 70, 80, and 90.
* **Y-axis:** BLEU Score, ranging from 0.0 to 1.0, with markers at 0.0, 0.2, 0.4, 0.6, 0.8, and 1.0.
* **Legend:** Located on the right side of the chart, it identifies the four conditions:
* None (light blue, dotted line, diamond marker)
* Prompt (light purple, solid line, square marker)
* Transformation (light red, dashed line, circle marker)
* Element (light green, dash-dot line, triangle marker)
### Detailed Analysis
* **None (Light Blue, Dotted Line, Diamond Marker):** The BLEU score remains almost constant at approximately 1.0 across all noise levels.
* At 10% Noise Level: BLEU Score ~ 1.0
* At 90% Noise Level: BLEU Score ~ 1.0
* **Prompt (Light Purple, Solid Line, Square Marker):** The BLEU score decreases as the noise level increases.
* At 10% Noise Level: BLEU Score ~ 0.9
* At 20% Noise Level: BLEU Score ~ 0.85
* At 30% Noise Level: BLEU Score ~ 0.78
* At 40% Noise Level: BLEU Score ~ 0.72
* At 50% Noise Level: BLEU Score ~ 0.66
* At 60% Noise Level: BLEU Score ~ 0.6
* At 70% Noise Level: BLEU Score ~ 0.54
* At 80% Noise Level: BLEU Score ~ 0.48
* At 90% Noise Level: BLEU Score ~ 0.43
* **Transformation (Light Red, Dashed Line, Circle Marker):** The BLEU score decreases as the noise level increases.
* At 10% Noise Level: BLEU Score ~ 0.9
* At 20% Noise Level: BLEU Score ~ 0.77
* At 30% Noise Level: BLEU Score ~ 0.65
* At 40% Noise Level: BLEU Score ~ 0.57
* At 50% Noise Level: BLEU Score ~ 0.47
* At 60% Noise Level: BLEU Score ~ 0.38
* At 70% Noise Level: BLEU Score ~ 0.3
* At 80% Noise Level: BLEU Score ~ 0.2
* At 90% Noise Level: BLEU Score ~ 0.1
* **Element (Light Green, Dash-Dot Line, Triangle Marker):** The BLEU score decreases sharply as the noise level increases, reaching near zero at higher noise levels.
* At 10% Noise Level: BLEU Score ~ 0.65
* At 20% Noise Level: BLEU Score ~ 0.45
* At 30% Noise Level: BLEU Score ~ 0.25
* At 40% Noise Level: BLEU Score ~ 0.15
* At 50% Noise Level: BLEU Score ~ 0.05
* At 60% Noise Level: BLEU Score ~ 0.02
* At 70% Noise Level: BLEU Score ~ 0.01
* At 80% Noise Level: BLEU Score ~ 0.00
* At 90% Noise Level: BLEU Score ~ 0.00
### Key Observations
* The "None" condition maintains a consistently high BLEU score regardless of the noise level.
* The "Element" condition is the most sensitive to noise, with its BLEU score dropping rapidly as noise increases.
* The "Prompt" and "Transformation" conditions show a gradual decrease in BLEU score as noise increases, with "Transformation" decreasing more rapidly than "Prompt".
### Interpretation
The chart demonstrates the impact of noise on the BLEU scores of different conditions. The "None" condition likely represents a baseline scenario without any added noise or modifications, hence its stable and high BLEU score. The "Element" condition is highly susceptible to noise, suggesting that the elements being evaluated are easily disrupted by noisy data. The "Prompt" and "Transformation" conditions show intermediate levels of sensitivity, indicating that these methods are somewhat robust to noise but still affected by it. The data suggests that the "None" condition is the most robust, while the "Element" condition is the least robust to noise. The "Prompt" condition is more robust than the "Transformation" condition.