## Line Chart: BLEU Score vs. Noise Level
### Overview
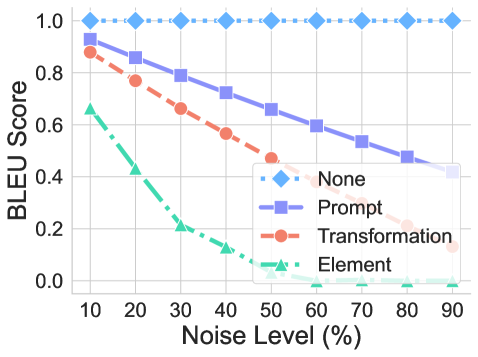
This chart illustrates the performance degradation of four different experimental methods ("None", "Prompt", "Transformation", and "Element") as the input noise level increases from 10% to 90%. The Y-axis represents the BLEU score (a metric for evaluating text generation quality), while the X-axis represents the percentage of noise introduced.
### Components/Axes
* **Y-Axis:** Labeled "BLEU Score". The scale ranges from 0.0 to 1.0, with grid lines at 0.0, 0.2, 0.4, 0.6, 0.8, and 1.0.
* **X-Axis:** Labeled "Noise Level (%)". The scale ranges from 10 to 90, with grid lines at 10, 20, 30, 40, 50, 60, 70, 80, and 90.
* **Legend:** Positioned in the center-right of the chart area.
* **None:** Light blue line with diamond markers.
* **Prompt:** Purple line with square markers.
* **Transformation:** Orange/Coral line with circle markers.
* **Element:** Teal/Green line with triangle markers.
### Detailed Analysis
The following data points are approximate based on visual inspection of the chart markers.
**Trend Verification:**
* **None:** A perfectly horizontal line at 1.0.
* **Prompt:** A steady, slightly curved downward slope.
* **Transformation:** A steeper downward curve compared to "Prompt".
* **Element:** A sharp, rapid downward curve, reaching near-zero values quickly.
**Data Points (Approximate Values):**
| Noise Level (%) | None (Blue) | Prompt (Purple) | Transformation (Orange) | Element (Teal) |
| :--- | :--- | :--- | :--- | :--- |
| 10 | 1.0 | ~0.92 | ~0.88 | ~0.65 |
| 20 | 1.0 | ~0.85 | ~0.76 | ~0.42 |
| 30 | 1.0 | ~0.78 | ~0.66 | ~0.21 |
| 40 | 1.0 | ~0.72 | ~0.56 | ~0.12 |
| 50 | 1.0 | ~0.65 | ~0.46 | ~0.06 |
| 60 | 1.0 | ~0.58 | ~0.38 | ~0.00 |
| 70 | 1.0 | ~0.52 | ~0.30 | ~0.00 |
| 80 | 1.0 | ~0.47 | ~0.20 | ~0.00 |
| 90 | 1.0 | ~0.41 | ~0.14 | ~0.00 |
### Key Observations
* **Baseline Stability:** The "None" method maintains a perfect BLEU score of 1.0 regardless of noise, serving as the control or upper bound.
* **Robustness Hierarchy:** The "Prompt" method is the most robust against noise, maintaining the highest BLEU scores among the variable methods across all noise levels.
* **Rapid Failure:** The "Element" method is highly sensitive to noise; it loses the majority of its performance by the 30% noise level and effectively hits a BLEU score of 0.0 by the 60% noise level.
* **Divergence:** The performance gap between "Prompt" and "Transformation" increases as the noise level rises, indicating that "Prompt" scales better in high-noise environments.
### Interpretation
This chart demonstrates the comparative robustness of different data processing or model-input strategies in the presence of input noise.
* **"None"** likely represents a clean, noise-free baseline or a scenario where the model is unaffected by the specific noise injection method.
* **"Prompt"** suggests a strategy (likely prompt engineering or a specific input formatting technique) that provides significant resilience, allowing the model to maintain semantic coherence even when 90% of the input is noisy.
* **"Transformation"** appears to be a moderately effective strategy, but it degrades significantly faster than "Prompt".
* **"Element"** appears to be a fragile strategy, possibly relying on specific, granular tokens or features that are easily corrupted by noise, rendering the model unable to generate coherent output once noise exceeds 30-40%.
In summary, if the goal is to maintain performance in noisy environments, the "Prompt" strategy is clearly superior to both "Transformation" and "Element".