## Line Graph: BLEU Score vs. Noise Level
### Overview
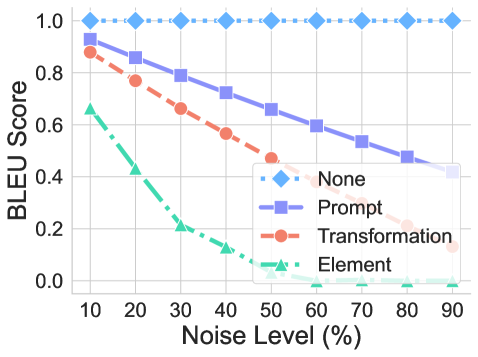
The image is a line graph comparing the performance of four methods ("None," "Prompt," "Transformation," "Element") in terms of BLEU score degradation under increasing noise levels (10% to 90%). The graph shows distinct trends for each method, with "None" maintaining a constant score and others declining progressively.
### Components/Axes
- **X-axis**: Noise Level (%) ranging from 10 to 90 in increments of 10.
- **Y-axis**: BLEU Score ranging from 0.0 to 1.0 in increments of 0.2.
- **Legend**: Located in the bottom-right corner, mapping:
- Blue diamonds: "None"
- Purple squares: "Prompt"
- Red circles: "Transformation"
- Green triangles: "Element"
### Detailed Analysis
1. **"None" (Blue Diamonds)**:
- **Trend**: Horizontal line at **1.0** across all noise levels.
- **Data Points**: Unchanged at 100% noise (1.0).
2. **"Prompt" (Purple Squares)**:
- **Trend**: Steady linear decline from ~0.95 (10% noise) to ~0.4 (90% noise).
- **Data Points**:
- 10%: ~0.95
- 20%: ~0.85
- 30%: ~0.75
- 40%: ~0.65
- 50%: ~0.55
- 60%: ~0.45
- 70%: ~0.35
- 80%: ~0.25
- 90%: ~0.15
3. **"Transformation" (Red Circles)**:
- **Trend**: Sharp linear decline from ~0.85 (10% noise) to ~0.15 (90% noise).
- **Data Points**:
- 10%: ~0.85
- 20%: ~0.75
- 30%: ~0.65
- 40%: ~0.55
- 50%: ~0.45
- 60%: ~0.35
- 70%: ~0.25
- 80%: ~0.15
- 90%: ~0.05
4. **"Element" (Green Triangles)**:
- **Trend**: Steepest decline from ~0.65 (10% noise) to ~0.05 (90% noise).
- **Data Points**:
- 10%: ~0.65
- 20%: ~0.55
- 30%: ~0.45
- 40%: ~0.35
- 50%: ~0.25
- 60%: ~0.15
- 70%: ~0.05
- 80%: ~0.02
- 90%: ~0.01
### Key Observations
- **"None"** remains unaffected by noise, suggesting it may represent a baseline or control condition.
- **"Prompt"** shows moderate resilience, retaining ~40% of its initial score at 90% noise.
- **"Transformation"** and **"Element"** degrade significantly, with "Element" being the most vulnerable.
- All methods except "None" exhibit a consistent linear relationship between noise level and BLEU score.
### Interpretation
The graph demonstrates that noise severely impacts BLEU scores for all methods except "None," which remains constant. This implies:
1. **"None"** may represent an idealized or noise-agnostic scenario (e.g., noiseless data or a theoretical upper bound).
2. **"Prompt"** offers the best trade-off between noise resilience and performance, retaining higher scores than other methods at high noise levels.
3. **"Transformation"** and **"Element"** are highly sensitive to noise, suggesting they rely on precise input conditions or lack robustness mechanisms.
4. The linear degradation patterns indicate that noise introduces systematic errors, disproportionately affecting methods dependent on structural or contextual cues (e.g., "Element" may involve positional or syntactic dependencies).
This analysis highlights the importance of noise robustness in NLP systems, with "Prompt" emerging as the most practical choice for noisy environments.