## Line Chart: Accuracy vs. Varying Maximum Depth
### Overview
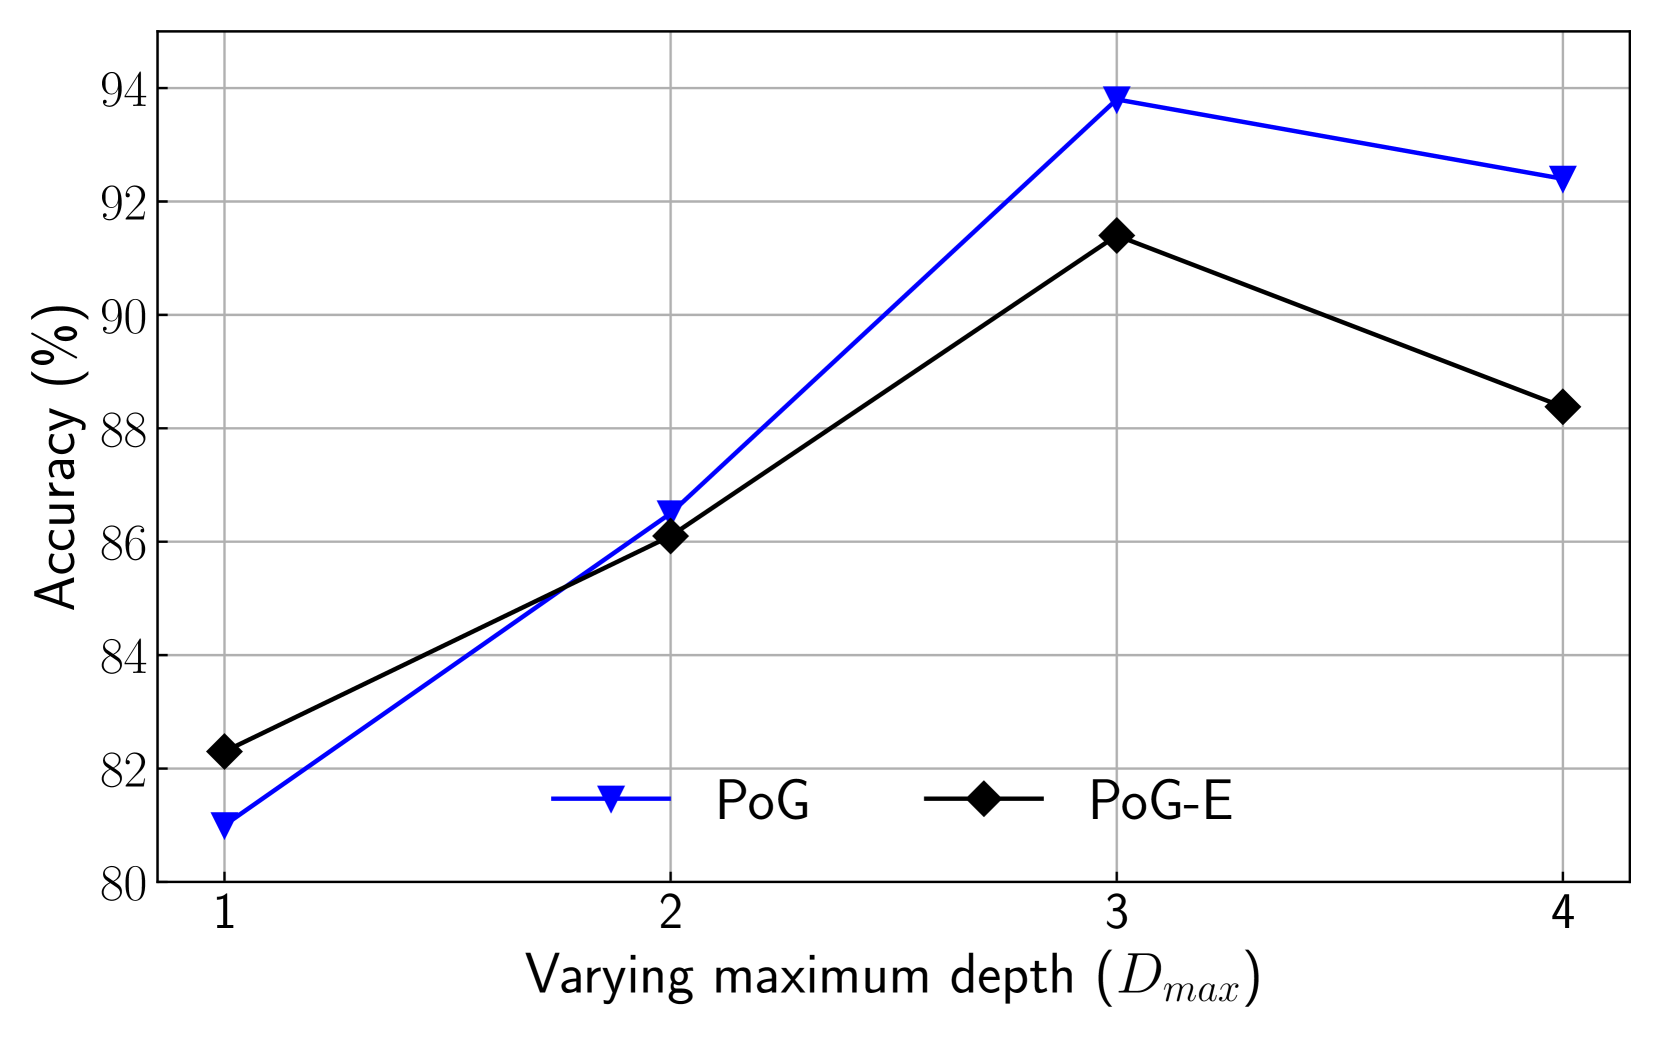
The image is a line chart comparing the accuracy (%) of two methods, PoG and PoG-E, across varying maximum depths (Dmax) from 1 to 4. The chart displays the relationship between the maximum depth and the accuracy achieved by each method.
### Components/Axes
* **X-axis:** Varying maximum depth (Dmax), with values 1, 2, 3, and 4.
* **Y-axis:** Accuracy (%), ranging from 80 to 94, with gridlines at each integer value.
* **Legend:** Located at the bottom-center of the chart.
* Blue line with downward-pointing triangle markers: PoG
* Black line with diamond markers: PoG-E
### Detailed Analysis
* **PoG (Blue Line):**
* At Dmax = 1, Accuracy ≈ 81%.
* At Dmax = 2, Accuracy ≈ 87%.
* At Dmax = 3, Accuracy ≈ 94%.
* At Dmax = 4, Accuracy ≈ 92.5%.
* Trend: The accuracy increases sharply from Dmax = 1 to Dmax = 3, then decreases slightly from Dmax = 3 to Dmax = 4.
* **PoG-E (Black Line):**
* At Dmax = 1, Accuracy ≈ 82.3%.
* At Dmax = 2, Accuracy ≈ 86.2%.
* At Dmax = 3, Accuracy ≈ 91.4%.
* At Dmax = 4, Accuracy ≈ 88.4%.
* Trend: The accuracy increases from Dmax = 1 to Dmax = 3, then decreases from Dmax = 3 to Dmax = 4.
### Key Observations
* Both PoG and PoG-E show an increase in accuracy as the maximum depth increases from 1 to 3.
* Both methods experience a decrease in accuracy when the maximum depth increases from 3 to 4.
* PoG generally has a higher accuracy than PoG-E for Dmax values of 2 and 3.
* PoG-E has a higher accuracy than PoG for Dmax value of 1.
* The peak accuracy for PoG is at Dmax = 3, while the peak accuracy for PoG-E is also at Dmax = 3.
### Interpretation
The data suggests that increasing the maximum depth (Dmax) initially improves the accuracy of both PoG and PoG-E methods. However, beyond a certain point (Dmax = 3), increasing the depth further leads to a decrease in accuracy, possibly due to overfitting. The optimal maximum depth for both methods appears to be around 3. The PoG method seems to perform slightly better than PoG-E at higher depths, but PoG-E performs better at lower depths. This information is valuable for tuning the parameters of these methods to achieve the best performance.