\n
## Line Chart: Accuracy vs. Maximum Depth
### Overview
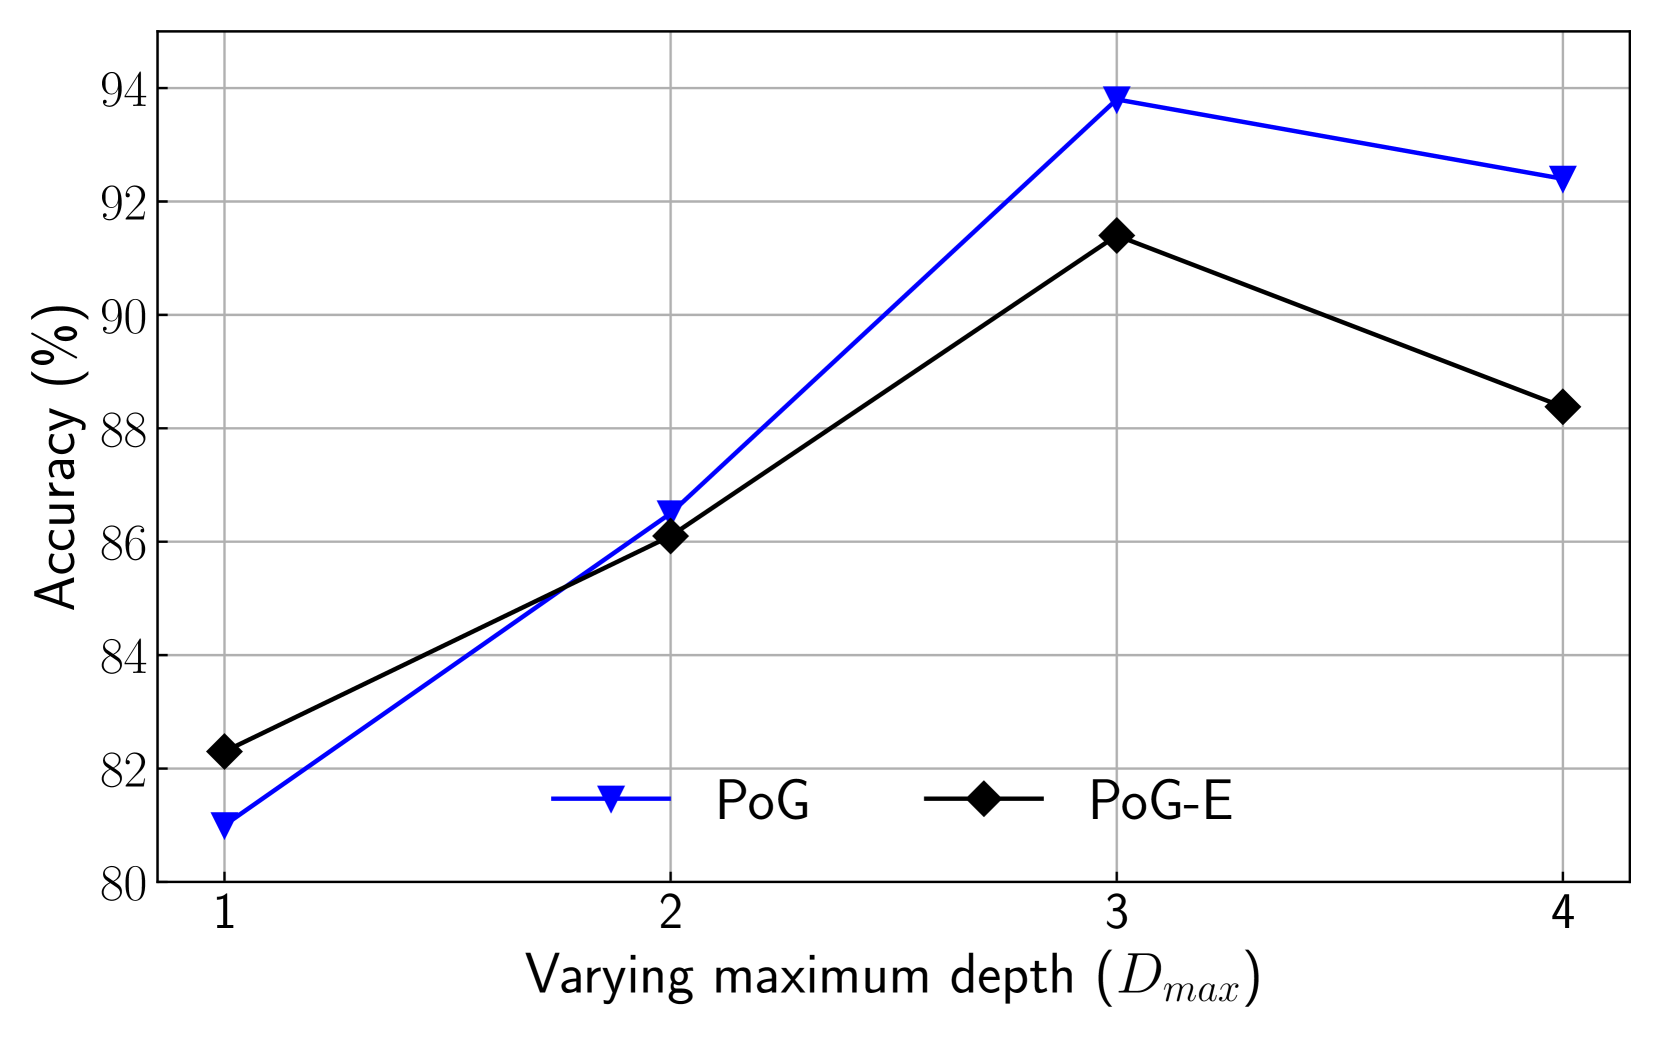
This line chart depicts the relationship between accuracy and varying maximum depth (Dmax) for two models: PoG and PoG-E. The chart shows how the accuracy of each model changes as the maximum depth increases from 1 to 4.
### Components/Axes
* **X-axis:** Varying maximum depth (Dmax), ranging from 1 to 4. The axis is labeled "Varying maximum depth (Dmax)".
* **Y-axis:** Accuracy (%), ranging from 80% to 94%. The axis is labeled "Accuracy (%)".
* **Data Series 1:** PoG, represented by a blue line with downward-pointing triangle markers.
* **Data Series 2:** PoG-E, represented by a black line with diamond markers.
* **Legend:** Located in the bottom-center of the chart, identifying the two data series (PoG and PoG-E) and their corresponding colors/markers.
### Detailed Analysis
**PoG (Blue Line):**
The PoG line slopes upward from Dmax = 1 to Dmax = 3, then slightly downward from Dmax = 3 to Dmax = 4.
* At Dmax = 1, Accuracy ≈ 81%.
* At Dmax = 2, Accuracy ≈ 85%.
* At Dmax = 3, Accuracy ≈ 94%.
* At Dmax = 4, Accuracy ≈ 93%.
**PoG-E (Black Line):**
The PoG-E line slopes upward from Dmax = 1 to Dmax = 3, then downward from Dmax = 3 to Dmax = 4.
* At Dmax = 1, Accuracy ≈ 82%.
* At Dmax = 2, Accuracy ≈ 86%.
* At Dmax = 3, Accuracy ≈ 92%.
* At Dmax = 4, Accuracy ≈ 88%.
### Key Observations
* Both models exhibit increasing accuracy as the maximum depth increases up to a point (Dmax = 3).
* PoG consistently outperforms PoG-E across all maximum depth values.
* Both models show a slight decrease in accuracy when the maximum depth is increased from 3 to 4.
* The largest performance gain for PoG occurs between Dmax = 2 and Dmax = 3.
* The largest performance gain for PoG-E occurs between Dmax = 1 and Dmax = 2.
### Interpretation
The data suggests that increasing the maximum depth of both PoG and PoG-E models initially improves their accuracy. However, beyond a certain depth (Dmax = 3 in this case), further increasing the depth may lead to overfitting or diminishing returns, resulting in a slight decrease in accuracy. PoG consistently demonstrates higher accuracy than PoG-E, indicating that it is a more robust model for this task. The slight decline in accuracy at Dmax = 4 for both models could indicate that the models are starting to overfit the training data at that depth. This suggests that a maximum depth of 3 might be optimal for these models, balancing accuracy and generalization ability. The difference in performance between the two models could be due to differences in their architectures or training procedures. Further investigation would be needed to determine the specific reasons for these differences.