## Stacked Bar Chart: Layer Distribution by Delta Value
### Overview
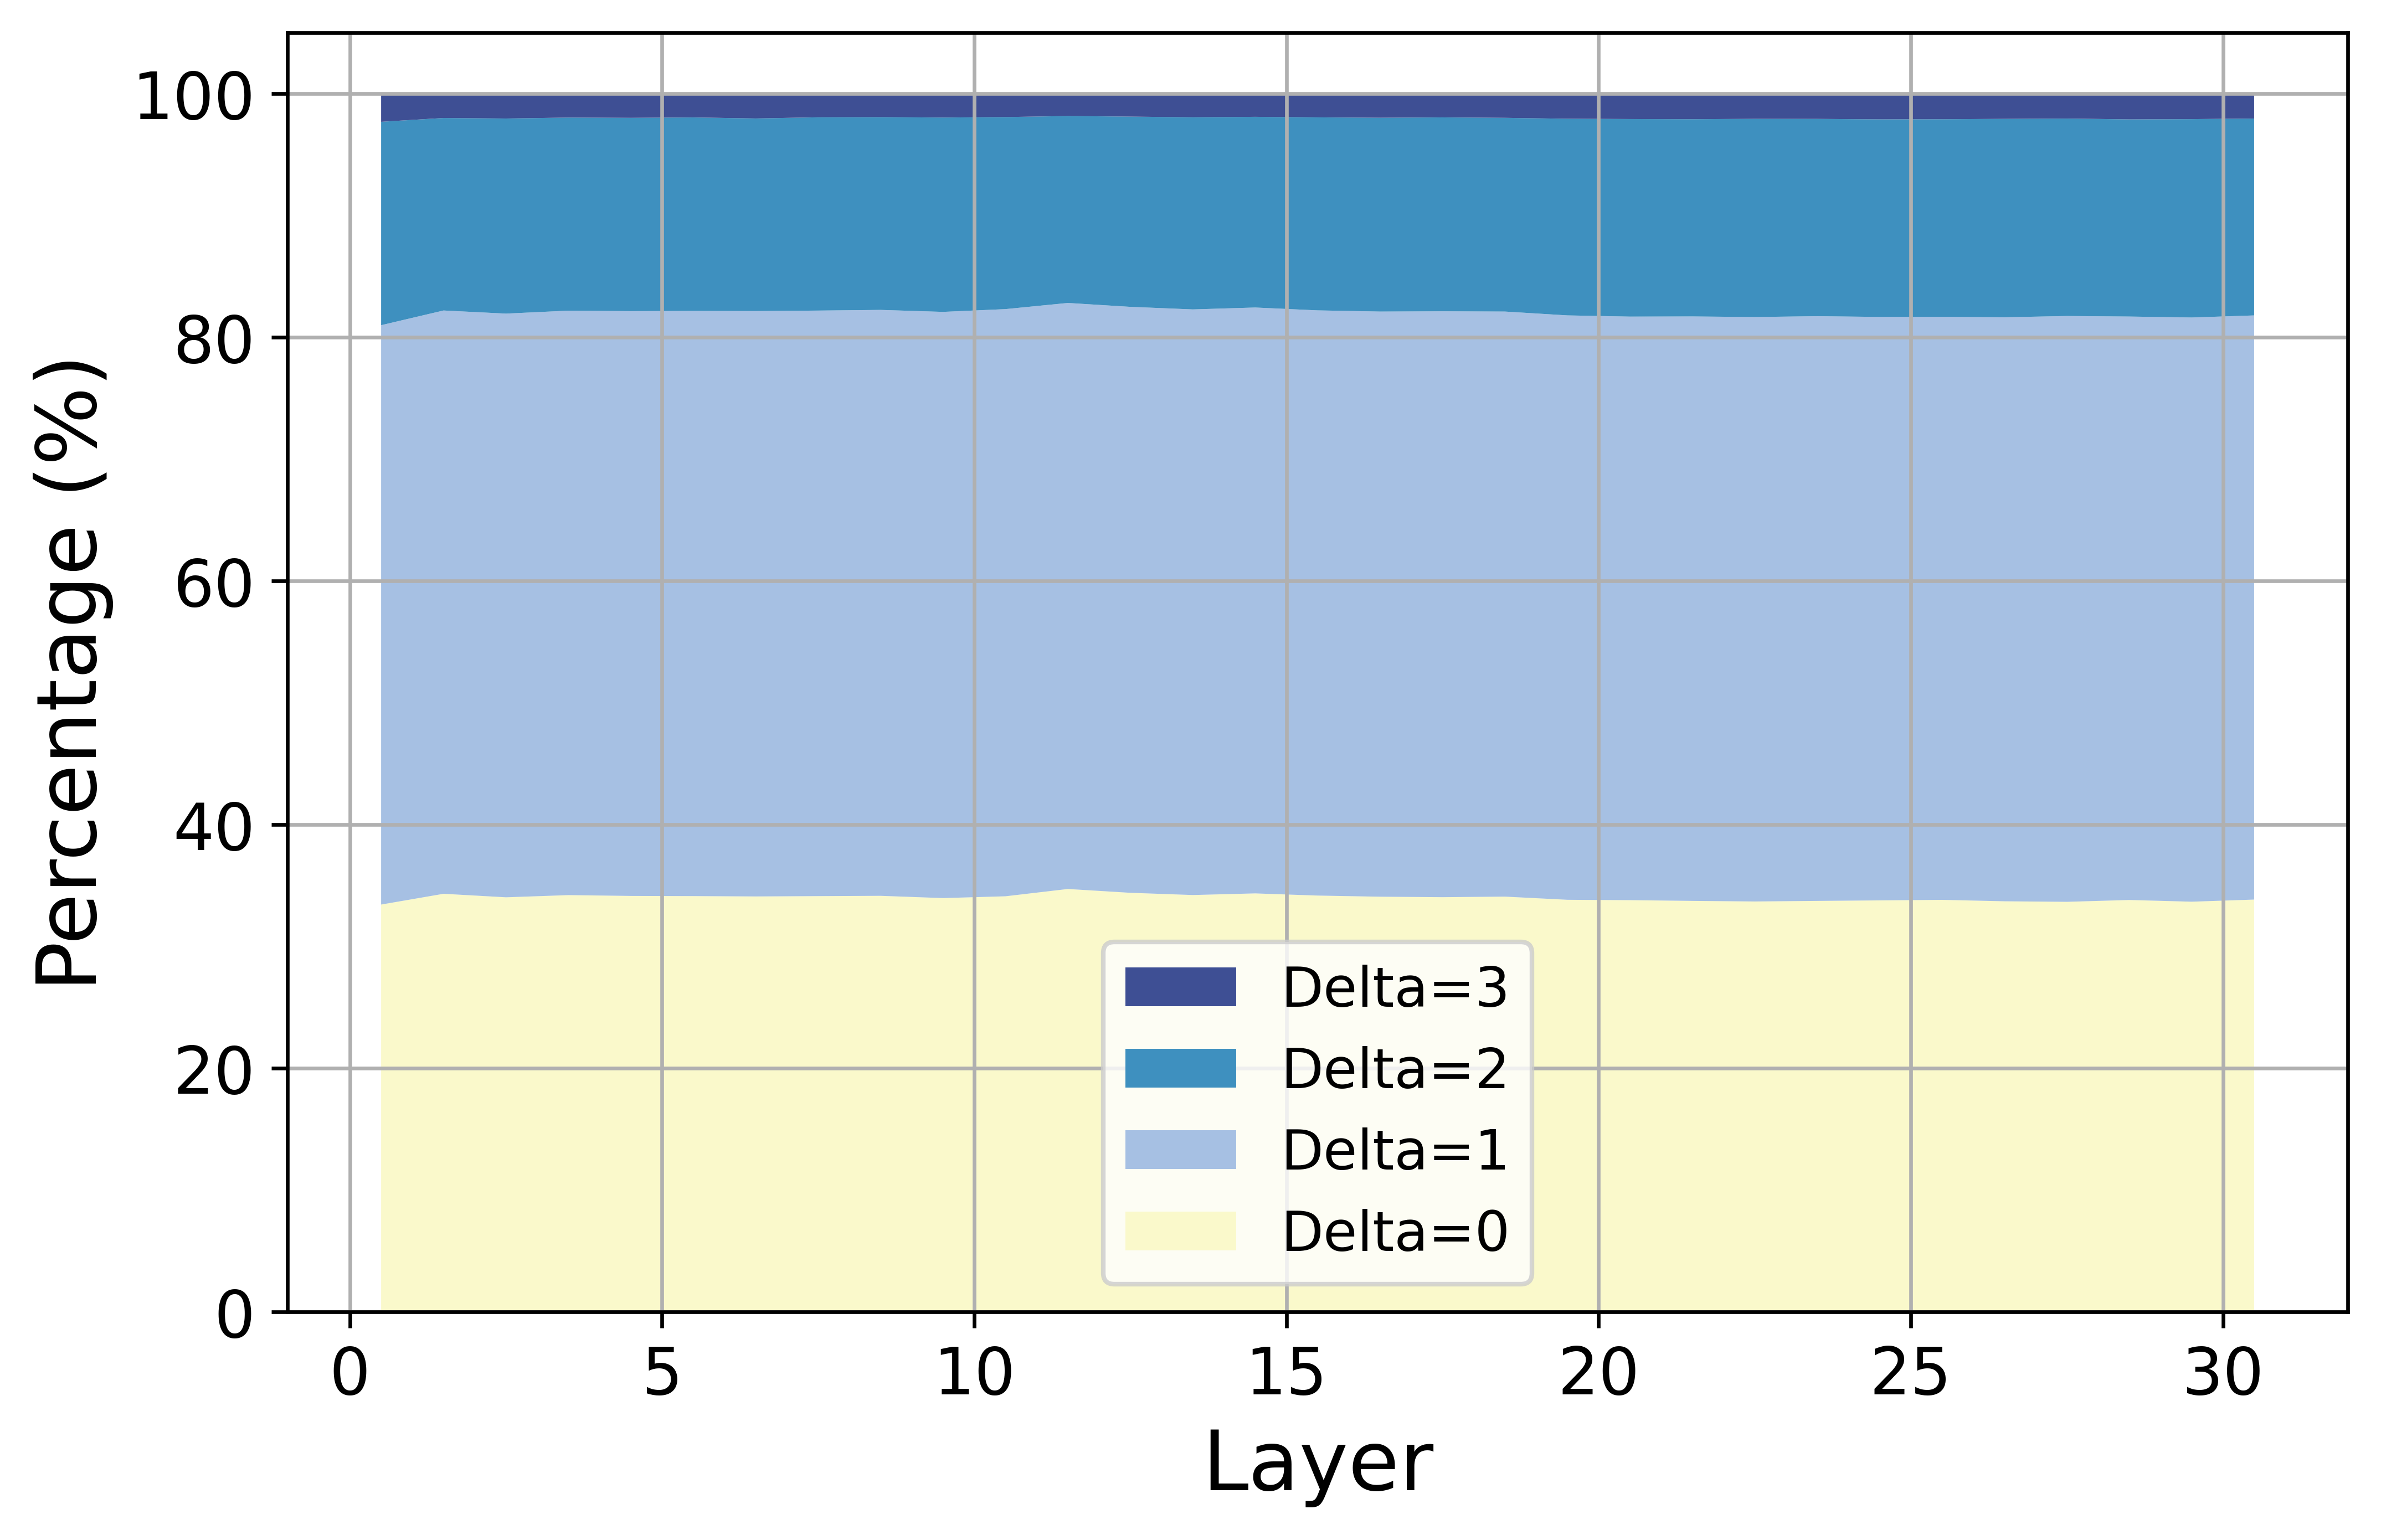
The image displays a stacked bar chart with four horizontal bars representing layers 0 to 30 on the x-axis. Each bar is divided into four color-coded segments corresponding to Delta values (0-3), with percentages summing to 100% for each layer. The chart emphasizes proportional distribution across layers.
### Components/Axes
- **X-axis (Layer)**: Labeled "Layer," with integer markers from 0 to 30 in increments of 5.
- **Y-axis (Percentage)**: Labeled "Percentage (%)" with markers from 0 to 100 in increments of 20.
- **Legend**: Located in the bottom-right corner, mapping:
- **Dark blue**: Delta=3
- **Teal**: Delta=2
- **Light blue**: Delta=1
- **Yellow**: Delta=0
### Detailed Analysis
- **Delta=0 (Yellow)**: Dominates each bar, occupying ~30-35% of the total height across all layers.
- **Delta=1 (Light blue)**: Second-largest segment, consistently ~45-50% of each bar.
- **Delta=2 (Teal)**: Third segment, ~15-20% of each bar.
- **Delta=3 (Dark blue)**: Smallest segment, ~5-10% of each bar.
- **Consistency**: All layers (0-30) exhibit identical proportional distributions, with no visible variation between bars.
### Key Observations
1. **Uniform Distribution**: Proportions of Delta values remain constant across all layers, suggesting no layer-specific anomalies or trends.
2. **Dominance of Delta=0**: The yellow segment (Delta=0) is the largest contributor in every layer, indicating it represents the most prevalent state.
3. **Stable Hierarchy**: The order of segment sizes (Delta=1 > Delta=0 > Delta=2 > Delta=3) is preserved uniformly.
### Interpretation
The chart demonstrates a stable, unchanging distribution of Delta values across all layers. This implies:
- **System Stability**: The underlying process or dataset maintains consistent proportions of Delta categories, with no significant shifts over time or conditions.
- **Baseline Representation**: Delta=0 likely represents a baseline or default state, while higher Deltas (1-3) denote incremental deviations or variations.
- **Predictability**: The uniformity suggests the system or data source exhibits predictable behavior, with no outliers or unexpected fluctuations.
### Spatial Grounding & Verification
- **Legend Placement**: Bottom-right corner, clearly separated from the chart.
- **Color Consistency**: All segments match legend colors exactly (e.g., dark blue for Delta=3 in all bars).
- **Axis Alignment**: X-axis labels are centered below bars; Y-axis percentages are left-aligned.
### Content Details
- **Layer 0**: Yellow (~35%), Light Blue (~50%), Teal (~15%), Dark Blue (~5%).
- **Layer 30**: Identical proportions to Layer 0, confirming uniformity.
- **No Intermediate Variations**: All layers replicate the same distribution pattern.
### Final Notes
The absence of numerical labels on the bars necessitates reliance on visual estimation. The chart’s simplicity emphasizes proportional relationships rather than absolute values, prioritizing comparative analysis over precise quantification.