## Stacked Area Chart: Distribution of Delta Values by Layer
### Overview
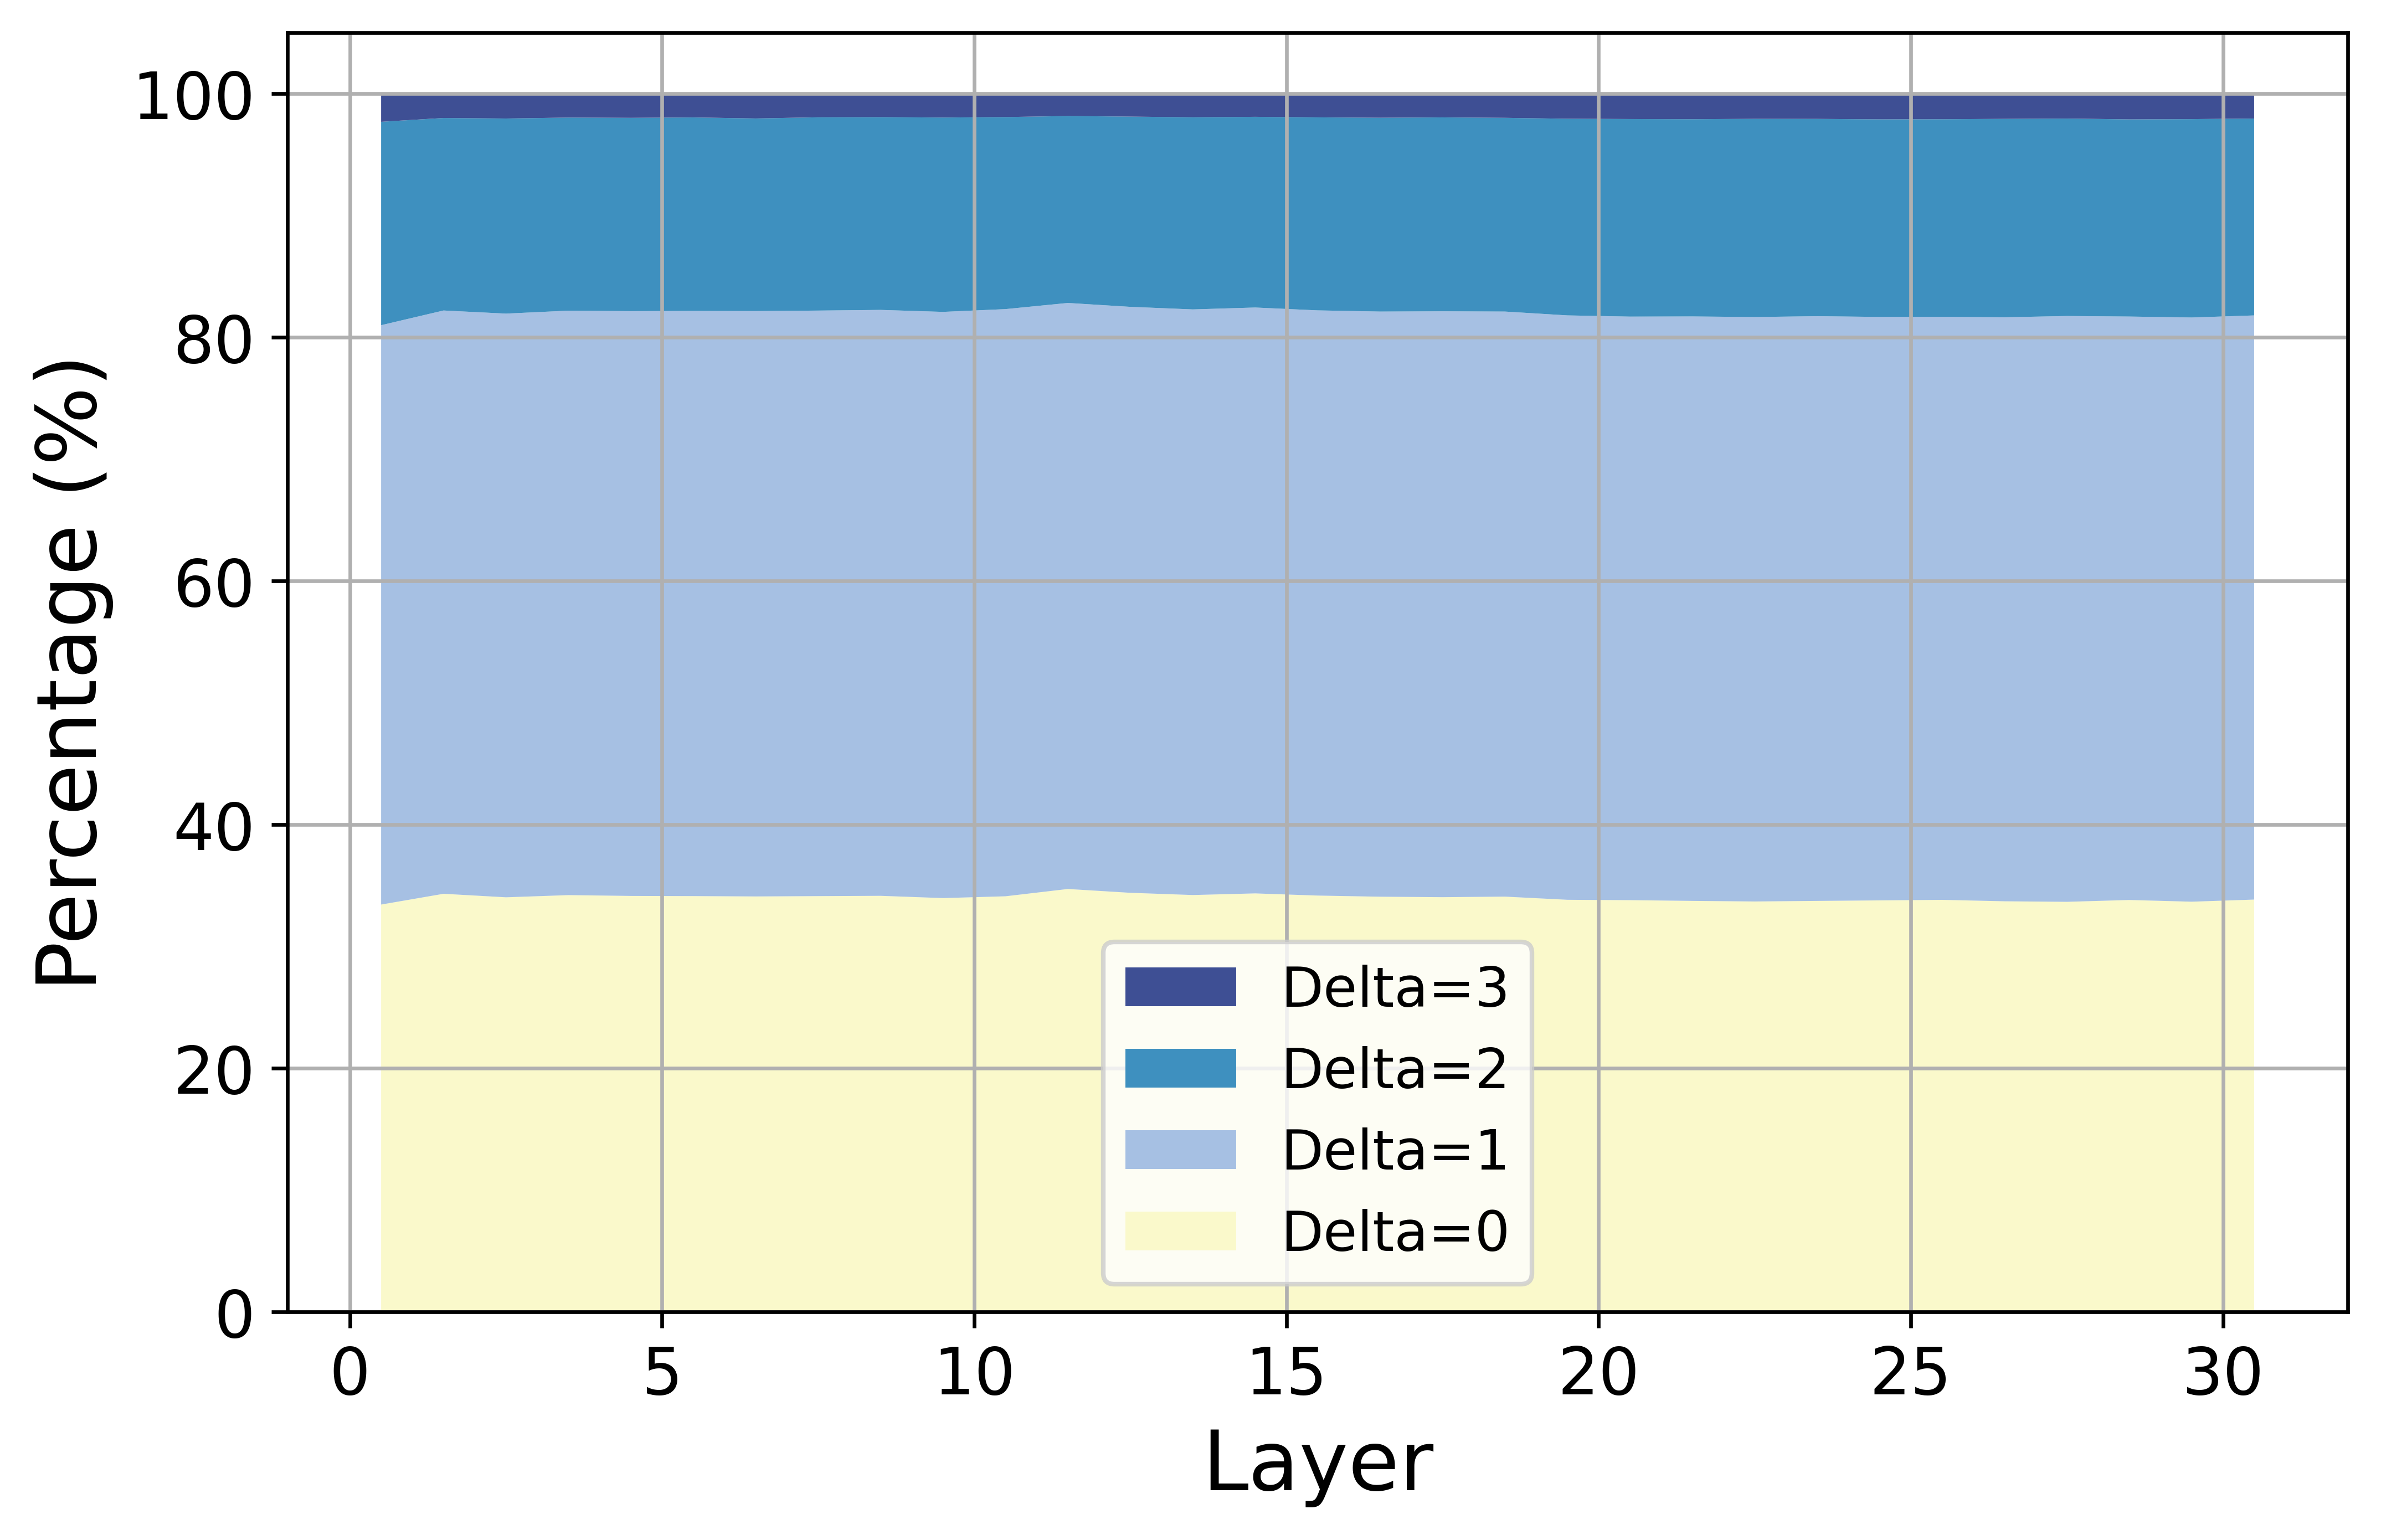
The image is a stacked area chart displaying the percentage distribution of four distinct categories (labeled "Delta=0" through "Delta=3") across 30 layers. The chart illustrates that the distribution of these categories remains remarkably consistent and stable across the entire range of layers (0 to 30).
### Components/Axes
* **X-Axis:** Labeled "Layer". The scale ranges from 0 to 30, with major grid lines marked at intervals of 5.
* **Y-Axis:** Labeled "Percentage (%)". The scale ranges from 0 to 100, with major grid lines marked at intervals of 20.
* **Legend:** Positioned in the bottom-center of the chart area.
* **Dark Blue:** Delta=3
* **Medium Blue:** Delta=2
* **Light Blue:** Delta=1
* **Pale Yellow:** Delta=0
### Detailed Analysis
The chart is a stacked area plot, meaning the total height of all combined areas equals 100% at every point along the X-axis.
* **Trend Verification:**
* **Delta=0 (Pale Yellow):** This category occupies the base of the chart. It maintains a consistent height of approximately 34% across all layers. There is a very slight, negligible upward shift around Layer 12.
* **Delta=1 (Light Blue):** This is the dominant category. It sits on top of the Pale Yellow area, starting at ~34% and extending to ~82%. This represents roughly 48% of the total distribution. The boundary line is nearly horizontal.
* **Delta=2 (Medium Blue):** This category sits above the Light Blue area, starting at ~82% and extending to ~98%. This represents roughly 16% of the total distribution.
* **Delta=3 (Dark Blue):** This is the top-most, thinnest category. It occupies the space from ~98% to 100%, representing a very small minority (approximately 2% of the total).
* **Spatial Grounding:**
* The boundaries between the color bands are almost perfectly parallel to the X-axis, indicating minimal variance in the data distribution as the "Layer" index increases.
### Key Observations
* **High Stability:** The most striking feature of this chart is the lack of significant change across the layers. The distribution of "Delta" values is essentially static from Layer 0 to Layer 30.
* **Dominant Category:** "Delta=1" is the most prevalent category, consistently accounting for nearly half of the total percentage.
* **Minority Category:** "Delta=3" is consistently the least frequent category, maintaining a thin, stable sliver at the top of the chart.
### Interpretation
* **Data Meaning:** This chart likely represents a metric (Delta) tracked across the depth of a computational model, such as a deep neural network (e.g., Transformer layers).
* **Invariance:** The fact that the distribution is flat suggests that the phenomenon being measured is invariant to the depth of the model. Whatever "Delta" represents, it is established early in the process and does not evolve or shift significantly as data passes through subsequent layers.
* **Investigative Insight:** If this were a model analysis, one might conclude that the "Delta" values are intrinsic properties of the input data or the initial embedding, rather than features learned or transformed by the deeper layers. The lack of dynamic change suggests the model's internal state regarding this specific metric is "locked in" from the start.