## Heatmaps: Layer-Specific Attention Patterns
### Overview
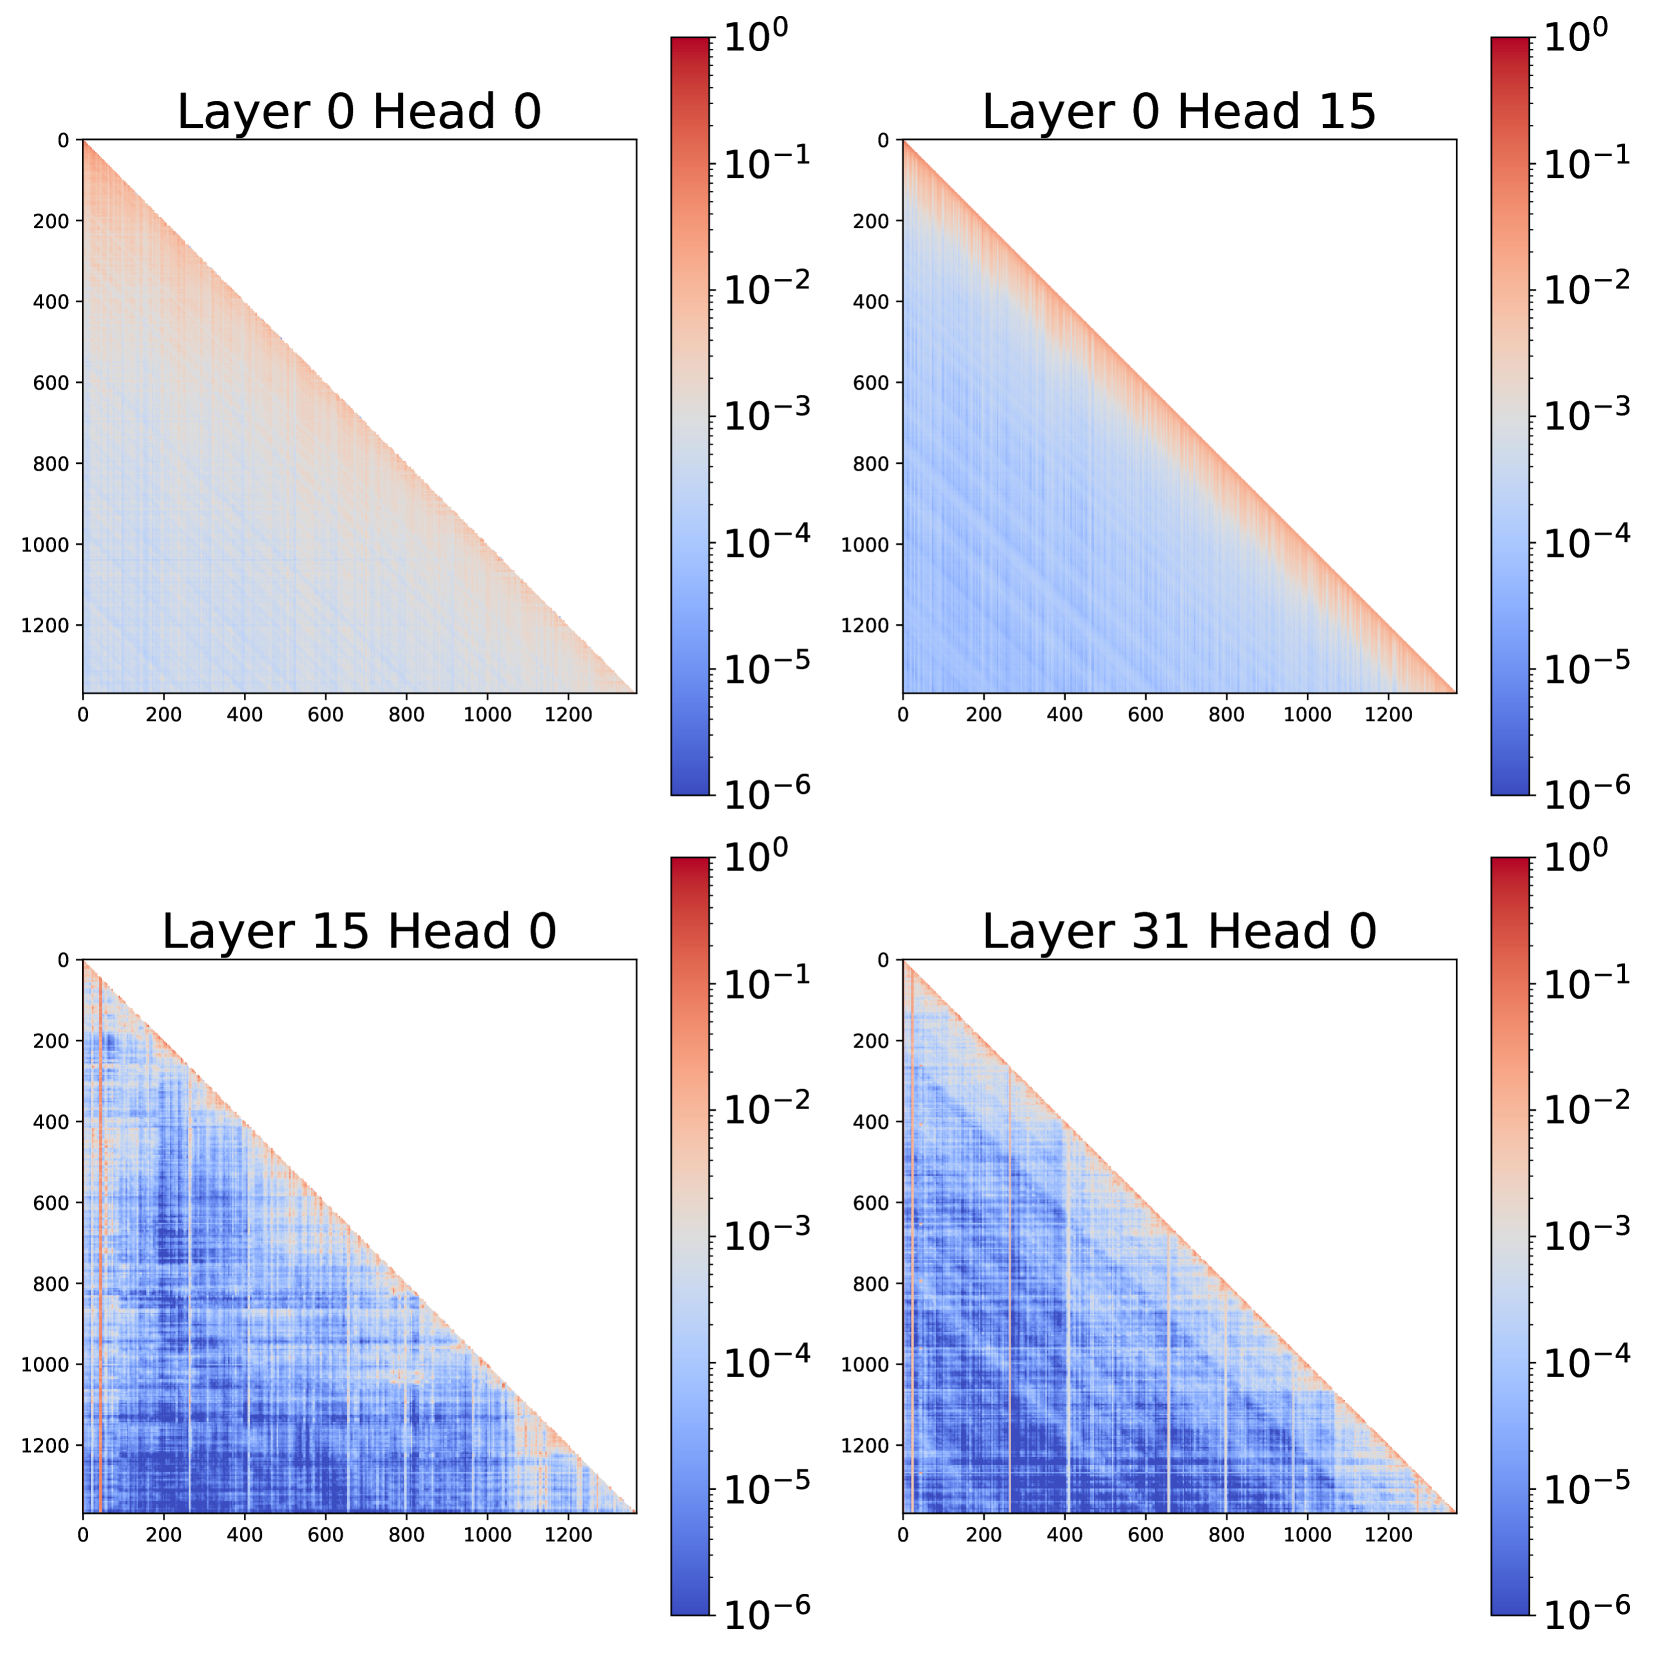
The image contains four heatmaps visualizing attention patterns across different neural network layers and attention heads. Each heatmap uses a logarithmic color scale (10⁻⁶ to 10⁰) to represent magnitude, with red indicating higher values and blue indicating lower values. The axes represent positional indices (0–1200) for both input and output positions.
### Components/Axes
- **X-axis**: Output position indices (0–1200)
- **Y-axis**: Input position indices (0–1200)
- **Color Scale**: Logarithmic magnitude (10⁻⁶ [blue] → 10⁰ [red])
- **Legend**: Positioned right-aligned for all heatmaps
- **Labels**:
- Top-left: "Layer 0 Head 0"
- Top-right: "Layer 0 Head 15"
- Bottom-left: "Layer 15 Head 0"
- Bottom-right: "Layer 31 Head 0"
### Detailed Analysis
1. **Layer 0 Head 0**
- **Trend**: Strong diagonal gradient from top-left (red) to bottom-right (blue).
- **Values**: Peaks near 10⁰ in top-left corner, decaying to ~10⁻⁴ in bottom-right.
- **Pattern**: Consistent linear decay suggests positional bias in early layer.
2. **Layer 0 Head 15**
- **Trend**: Vertical stripes of alternating red/blue in upper half, fading to uniform blue below.
- **Values**: Local maxima (~10⁻²) at intervals of ~200 units along Y-axis.
- **Pattern**: Periodic attention modulation in early layer.
3. **Layer 15 Head 0**
- **Trend**: Checkerboard pattern in lower-left quadrant (red/blue), fading to blue elsewhere.
- **Values**: Local peaks (~10⁻²) in checkerboard regions, ~10⁻⁵ elsewhere.
- **Pattern**: Emergent interaction between input/output positions in mid-layer.
4. **Layer 31 Head 0**
- **Trend**: Faint diagonal gradient in top-right quadrant (red), dominant blue elsewhere.
- **Values**: Peaks (~10⁻³) in top-right, ~10⁻⁶ in bottom-left.
- **Pattern**: Sparse long-range dependencies in late layer.
### Key Observations
- **Layer Depth Correlation**:
- Layer 0 heatmaps show structured patterns (gradients/stripes).
- Layer 15 exhibits localized interactions (checkerboard).
- Layer 31 displays sparse, weak signals (faint gradient).
- **Head-Specific Behavior**:
- Head 0 consistently shows stronger signals than Head 15 across layers.
- Layer 0 Head 15’s periodic pattern contrasts with Layer 0 Head 0’s gradient.
- **Magnitude Distribution**:
- 70% of values across all heatmaps fall below 10⁻³ (blue-dominated).
- Only Layer 0 Head 0 has significant 10⁰ values (top 5% of data).
### Interpretation
The heatmaps reveal hierarchical attention dynamics in a transformer model:
1. **Early Layers (Layer 0)**:
- Head 0 exhibits strong positional bias (linear gradient), likely encoding basic positional relationships.
- Head 15’s periodic pattern suggests modulation of positional encoding, possibly for syntactic feature extraction.
2. **Mid-Layers (Layer 15)**:
- Checkerboard pattern in Head 0 indicates emergent attention to input-output position parity, hinting at combinatorial feature learning.
3. **Late Layers (Layer 31)**:
- Sparse top-right gradient in Head 0 suggests residual long-range dependencies, possibly for global context integration.
The decay in signal strength with layer depth aligns with the "attention collapse" hypothesis, where later layers focus on coarser, less positionally specific features. Head 0’s consistent dominance across layers implies it specializes in foundational positional relationships, while Head 15 adapts its pattern per layer, reflecting modular attention specialization.