## Argument Graph: Vaccine Safety
### Overview
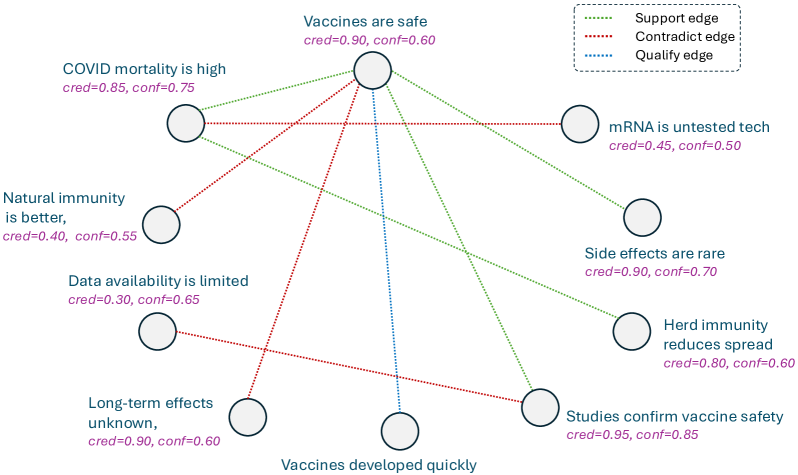
The image is an argument graph visually representing the relationships between different statements related to vaccine safety. The graph consists of nodes representing claims, and edges representing the relationships between these claims (support, contradict, qualify). Each claim is associated with a credibility score (cred) and a confidence score (conf).
### Components/Axes
* **Nodes:** Each node represents a statement or claim. The claims are:
* "COVID mortality is high" (cred=0.85, conf=0.75)
* "Natural immunity is better" (cred=0.40, conf=0.55)
* "Data availability is limited" (cred=0.30, conf=0.65)
* "Long-term effects unknown" (cred=0.90, conf=0.60)
* "Vaccines are safe" (cred=0.90, conf=0.60)
* "Vaccines developed quickly"
* "mRNA is untested tech" (cred=0.45, conf=0.50)
* "Side effects are rare" (cred=0.90, conf=0.70)
* "Herd immunity reduces spread" (cred=0.80, conf=0.60)
* "Studies confirm vaccine safety" (cred=0.95, conf=0.85)
* **Edges:** Edges represent the relationships between the claims.
* Green dotted lines: "Support edge"
* Red dotted lines: "Contradict edge"
* Blue dotted lines: "Qualify edge"
* **Legend:** Located in the top-right corner, the legend explains the meaning of the different colored edges.
* **Credibility (cred):** A numerical value associated with each claim, representing the credibility of the claim.
* **Confidence (conf):** A numerical value associated with each claim, representing the confidence in the claim.
### Detailed Analysis or Content Details
Here's a breakdown of the connections between the claims:
* **"Vaccines are safe"** (cred=0.90, conf=0.60):
* Supported by: "COVID mortality is high", "Side effects are rare", "Herd immunity reduces spread", "Studies confirm vaccine safety" (Green dotted lines)
* Contradicted by: "Natural immunity is better", "mRNA is untested tech", "Vaccines developed quickly" (Red dotted lines)
* Qualified by: "Long-term effects unknown" (Blue dotted line)
* **"COVID mortality is high"** (cred=0.85, conf=0.75):
* Supports: "Vaccines are safe" (Green dotted line)
* **"Natural immunity is better"** (cred=0.40, conf=0.55):
* Contradicts: "Vaccines are safe" (Red dotted line)
* **"Data availability is limited"** (cred=0.30, conf=0.65):
* No connections shown.
* **"Long-term effects unknown"** (cred=0.90, conf=0.60):
* Qualifies: "Vaccines are safe" (Blue dotted line)
* **"Vaccines developed quickly"**:
* Contradicts: "Vaccines are safe" (Red dotted line)
* **"mRNA is untested tech"** (cred=0.45, conf=0.50):
* Contradicts: "Vaccines are safe" (Red dotted line)
* **"Side effects are rare"** (cred=0.90, conf=0.70):
* Supports: "Vaccines are safe" (Green dotted line)
* **"Herd immunity reduces spread"** (cred=0.80, conf=0.60):
* Supports: "Vaccines are safe" (Green dotted line)
* **"Studies confirm vaccine safety"** (cred=0.95, conf=0.85):
* Supports: "Vaccines are safe" (Green dotted line)
### Key Observations
* The central claim, "Vaccines are safe," has the most connections, indicating its importance in the argument.
* The claim "Vaccines are safe" has a high credibility (0.90) but a moderate confidence (0.60).
* The claims supporting "Vaccines are safe" generally have high credibility and confidence scores.
* The claims contradicting "Vaccines are safe" have lower credibility scores.
* The claim "Data availability is limited" is isolated and does not connect to any other claims in the graph.
### Interpretation
The argument graph visually summarizes the debate surrounding vaccine safety. The central claim, "Vaccines are safe," is supported by multiple arguments related to COVID mortality, side effects, herd immunity, and scientific studies. However, it is also contradicted by arguments related to natural immunity, the novelty of mRNA technology, and the speed of vaccine development. The credibility and confidence scores associated with each claim provide a quantitative assessment of the strength of each argument.
The graph suggests that the arguments supporting vaccine safety are generally stronger (higher credibility and confidence) than the arguments against it. However, the presence of contradicting and qualifying arguments indicates that the issue is complex and not without valid concerns. The isolated claim about data availability suggests a potential area for further investigation and improvement.