\n
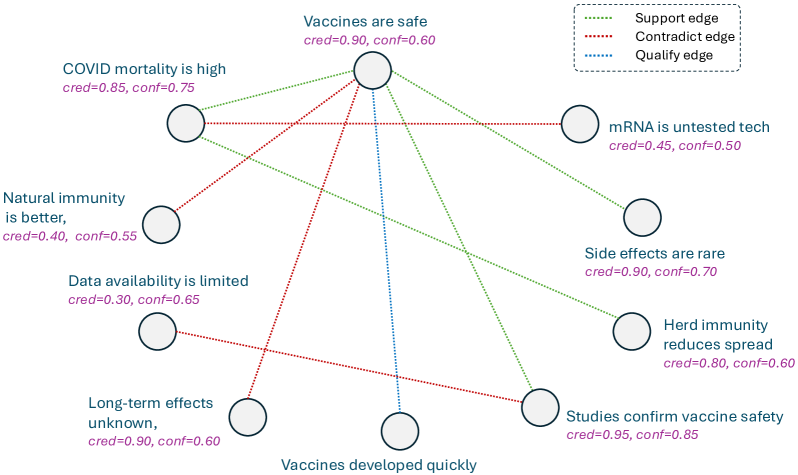
## Network Diagram: Vaccine Beliefs and Relationships
### Overview
This image presents a network diagram illustrating relationships between different beliefs related to vaccines and COVID-19. Nodes represent statements, and edges represent relationships between them, categorized as "Support," "Contradict," or "Qualify." Each node is labeled with a statement and associated credibility (cred) and confidence (conf) scores.
### Components/Axes
The diagram consists of interconnected nodes (circles) with text labels. Edges (lines) connect these nodes, with different line styles indicating the type of relationship:
* **Solid Green Line:** Support edge
* **Dashed Red Line:** Contradict edge
* **Solid Grey Line:** Qualify edge
The top-right corner contains a legend explaining the edge types. Each node displays two numerical values: "cred" (credibility) and "conf" (confidence).
### Detailed Analysis or Content Details
The following nodes and their relationships are present:
1. **Vaccines are safe:** cred=0.90, conf=0.60. This node is centrally located and has multiple connections.
* Supported by: "Studies confirm vaccine safety" (green line)
* Supported by: "Side effects are rare" (green line)
* Qualified by: "Long-term effects unknown" (grey line)
* Contradicted by: "COVID mortality is high" (red dashed line)
2. **COVID mortality is high:** cred=0.85, conf=0.75. Located towards the top-left.
* Contradicts: "Vaccines are safe" (red dashed line)
* Contradicts: "Herd immunity reduces spread" (red dashed line)
* Qualified by: "Data availability is limited" (grey line)
3. **Natural immunity is better:** cred=0.40, conf=0.55. Located on the left side.
* Contradicts: "Vaccines are safe" (red dashed line)
* Qualified by: "Data availability is limited" (grey line)
4. **Data availability is limited:** cred=0.30, conf=0.65. Located below "Natural immunity is better".
* Qualifies: "COVID mortality is high" (grey line)
* Qualifies: "Natural immunity is better" (grey line)
5. **Long-term effects unknown:** cred=0.90, conf=0.60. Located towards the bottom-left.
* Qualifies: "Vaccines are safe" (grey line)
6. **Vaccines developed quickly:** cred=0.70, conf=0.60. Located towards the bottom-center.
* Contradicts: "Vaccines are safe" (red dashed line)
* Supported by: "Studies confirm vaccine safety" (green line)
7. **mRNA is untested tech:** cred=0.45, conf=0.50. Located on the right side.
* Contradicts: "Vaccines are safe" (red dashed line)
8. **Side effects are rare:** cred=0.90, conf=0.70. Located on the right side.
* Supports: "Vaccines are safe" (green line)
9. **Herd immunity reduces spread:** cred=0.80, conf=0.60. Located on the right side.
* Contradicted by: "COVID mortality is high" (red dashed line)
10. **Studies confirm vaccine safety:** cred=0.95, conf=0.85. Located towards the bottom-right.
* Supports: "Vaccines are safe" (green line)
* Supports: "Vaccines developed quickly" (green line)
### Key Observations
* "Vaccines are safe" is the most central node, with the most connections (both supporting and contradicting).
* "COVID mortality is high" and "Natural immunity is better" are primarily contradicted by other beliefs.
* "Data availability is limited" acts as a qualifier, suggesting uncertainty around other statements.
* The credibility scores are generally high (above 0.70) for statements supporting vaccine safety, while those contradicting it tend to be lower.
* Confidence scores are generally lower than credibility scores across all statements.
### Interpretation
This network diagram represents a complex web of beliefs surrounding vaccines and COVID-19. The diagram suggests that the belief in vaccine safety is central, but it is also subject to debate and qualification. The presence of contradicting edges indicates conflicting viewpoints and potential misinformation. The credibility and confidence scores provide a measure of the strength of each belief, with higher credibility suggesting greater acceptance within the represented data. The diagram highlights the importance of considering multiple perspectives and acknowledging the uncertainties surrounding these issues. The qualifier "Data availability is limited" suggests that many of these beliefs are based on incomplete information, which could contribute to the conflicting viewpoints. The diagram is a visualization of a belief network, and does not necessarily represent objective truth. It reflects the relationships between beliefs as they exist within the data used to construct the network.