## Line Chart: Brain Alignment vs. Pythia Model Size
### Overview
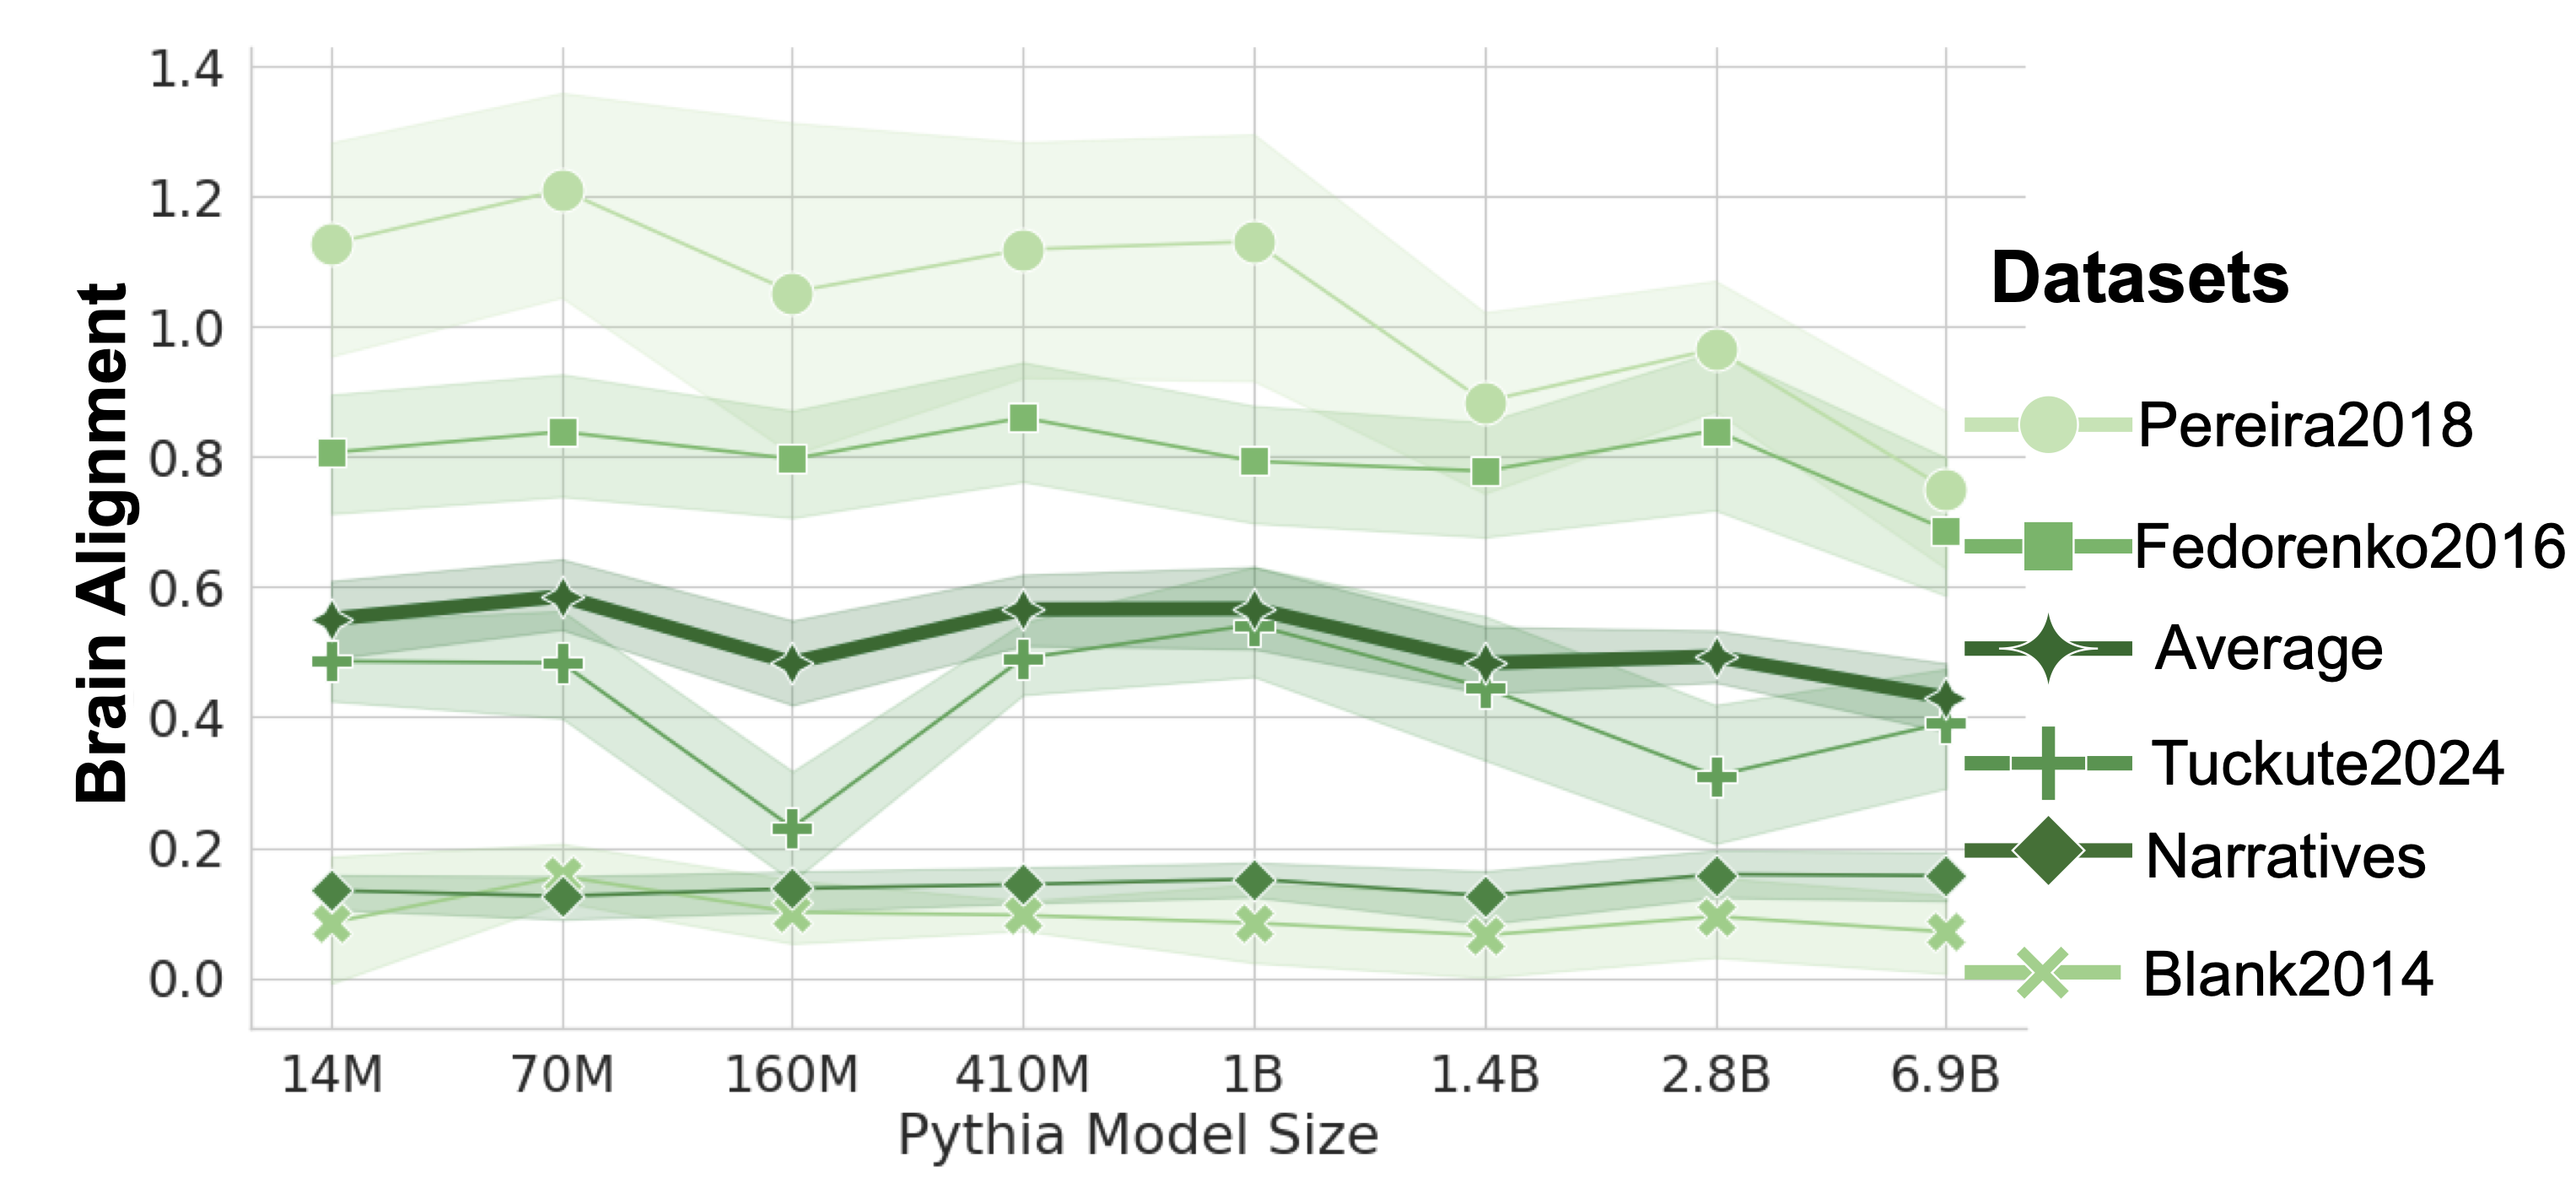
The image is a line chart comparing brain alignment scores across different datasets as a function of Pythia model size. The chart displays six datasets: Pereira2018, Fedorenko2016, Average, Tuckute2024, Narratives, and Blank2014. The x-axis represents the Pythia model size, and the y-axis represents the brain alignment score. Each dataset is represented by a line with a specific color and marker. Shaded regions around each line indicate the uncertainty or variability in the data.
### Components/Axes
* **Title:** None
* **X-axis:** Pythia Model Size
* Scale: 14M, 70M, 160M, 410M, 1B, 1.4B, 2.8B, 6.9B
* **Y-axis:** Brain Alignment
* Scale: 0.0, 0.2, 0.4, 0.6, 0.8, 1.0, 1.2, 1.4
* **Legend:** Located on the top-right of the chart.
* Pereira2018 (light green, circle marker)
* Fedorenko2016 (green, square marker)
* Average (dark green, diamond marker)
* Tuckute2024 (light green, plus marker)
* Narratives (dark green, diamond marker)
* Blank2014 (light green, x marker)
### Detailed Analysis
* **Pereira2018 (light green, circle marker):** The line starts at approximately 1.15 at 14M, increases to approximately 1.25 at 70M, decreases to approximately 1.1 at 160M, remains relatively stable at approximately 1.13 at 410M and 1B, decreases to approximately 0.9 at 2.8B, and further decreases to approximately 0.7 at 6.9B.
* **Fedorenko2016 (green, square marker):** The line starts at approximately 0.8 at 14M, remains relatively stable at approximately 0.8 at 70M, decreases slightly to approximately 0.78 at 160M, remains relatively stable at approximately 0.78 at 410M and 1B, increases slightly to approximately 0.84 at 2.8B, and decreases to approximately 0.75 at 6.9B.
* **Average (dark green, diamond marker):** The line starts at approximately 0.55 at 14M, increases slightly to approximately 0.58 at 70M and 410M, decreases to approximately 0.48 at 1.4B, remains relatively stable at approximately 0.49 at 2.8B, and decreases to approximately 0.42 at 6.9B. This line is thicker than the others.
* **Tuckute2024 (light green, plus marker):** The line starts at approximately 0.48 at 14M, increases slightly to approximately 0.5 at 70M and 410M, decreases to approximately 0.3 at 1B, remains relatively stable at approximately 0.32 at 1.4B, decreases to approximately 0.18 at 2.8B, and remains relatively stable at approximately 0.18 at 6.9B.
* **Narratives (dark green, diamond marker):** The line starts at approximately 0.13 at 14M, increases slightly to approximately 0.14 at 70M, remains relatively stable at approximately 0.13 at 160M, decreases slightly to approximately 0.12 at 410M, remains relatively stable at approximately 0.12 at 1B, increases slightly to approximately 0.17 at 2.8B, and remains relatively stable at approximately 0.17 at 6.9B.
* **Blank2014 (light green, x marker):** The line starts at approximately 0.08 at 14M, increases slightly to approximately 0.12 at 70M, remains relatively stable at approximately 0.1 at 160M, increases slightly to approximately 0.11 at 410M, remains relatively stable at approximately 0.09 at 1B, increases slightly to approximately 0.1 at 1.4B, remains relatively stable at approximately 0.1 at 2.8B, and remains relatively stable at approximately 0.08 at 6.9B.
### Key Observations
* The Pereira2018 dataset has the highest brain alignment scores across all model sizes.
* The Blank2014 dataset has the lowest brain alignment scores across all model sizes.
* The "Average" dataset line is thicker than the other lines, making it visually distinct.
* Most datasets show a decrease in brain alignment as the Pythia model size increases beyond 1B.
* The shaded regions around each line indicate variability in the data, with some datasets showing more variability than others.
### Interpretation
The chart suggests that brain alignment scores vary significantly across different datasets when evaluated against Pythia models of varying sizes. The Pereira2018 dataset consistently shows the highest alignment, indicating it may be more compatible or better represented by these models. Conversely, the Blank2014 dataset shows the lowest alignment. The general trend for most datasets is a decrease in brain alignment as the Pythia model size increases beyond 1B, which could indicate a point of diminishing returns or overfitting for larger models. The "Average" dataset provides a consolidated view of overall performance. The variability indicated by the shaded regions suggests that the alignment scores are not precise and may be influenced by other factors not represented in the chart.