## Line Chart: Brain Alignment Across Pythia Model Sizes
### Overview
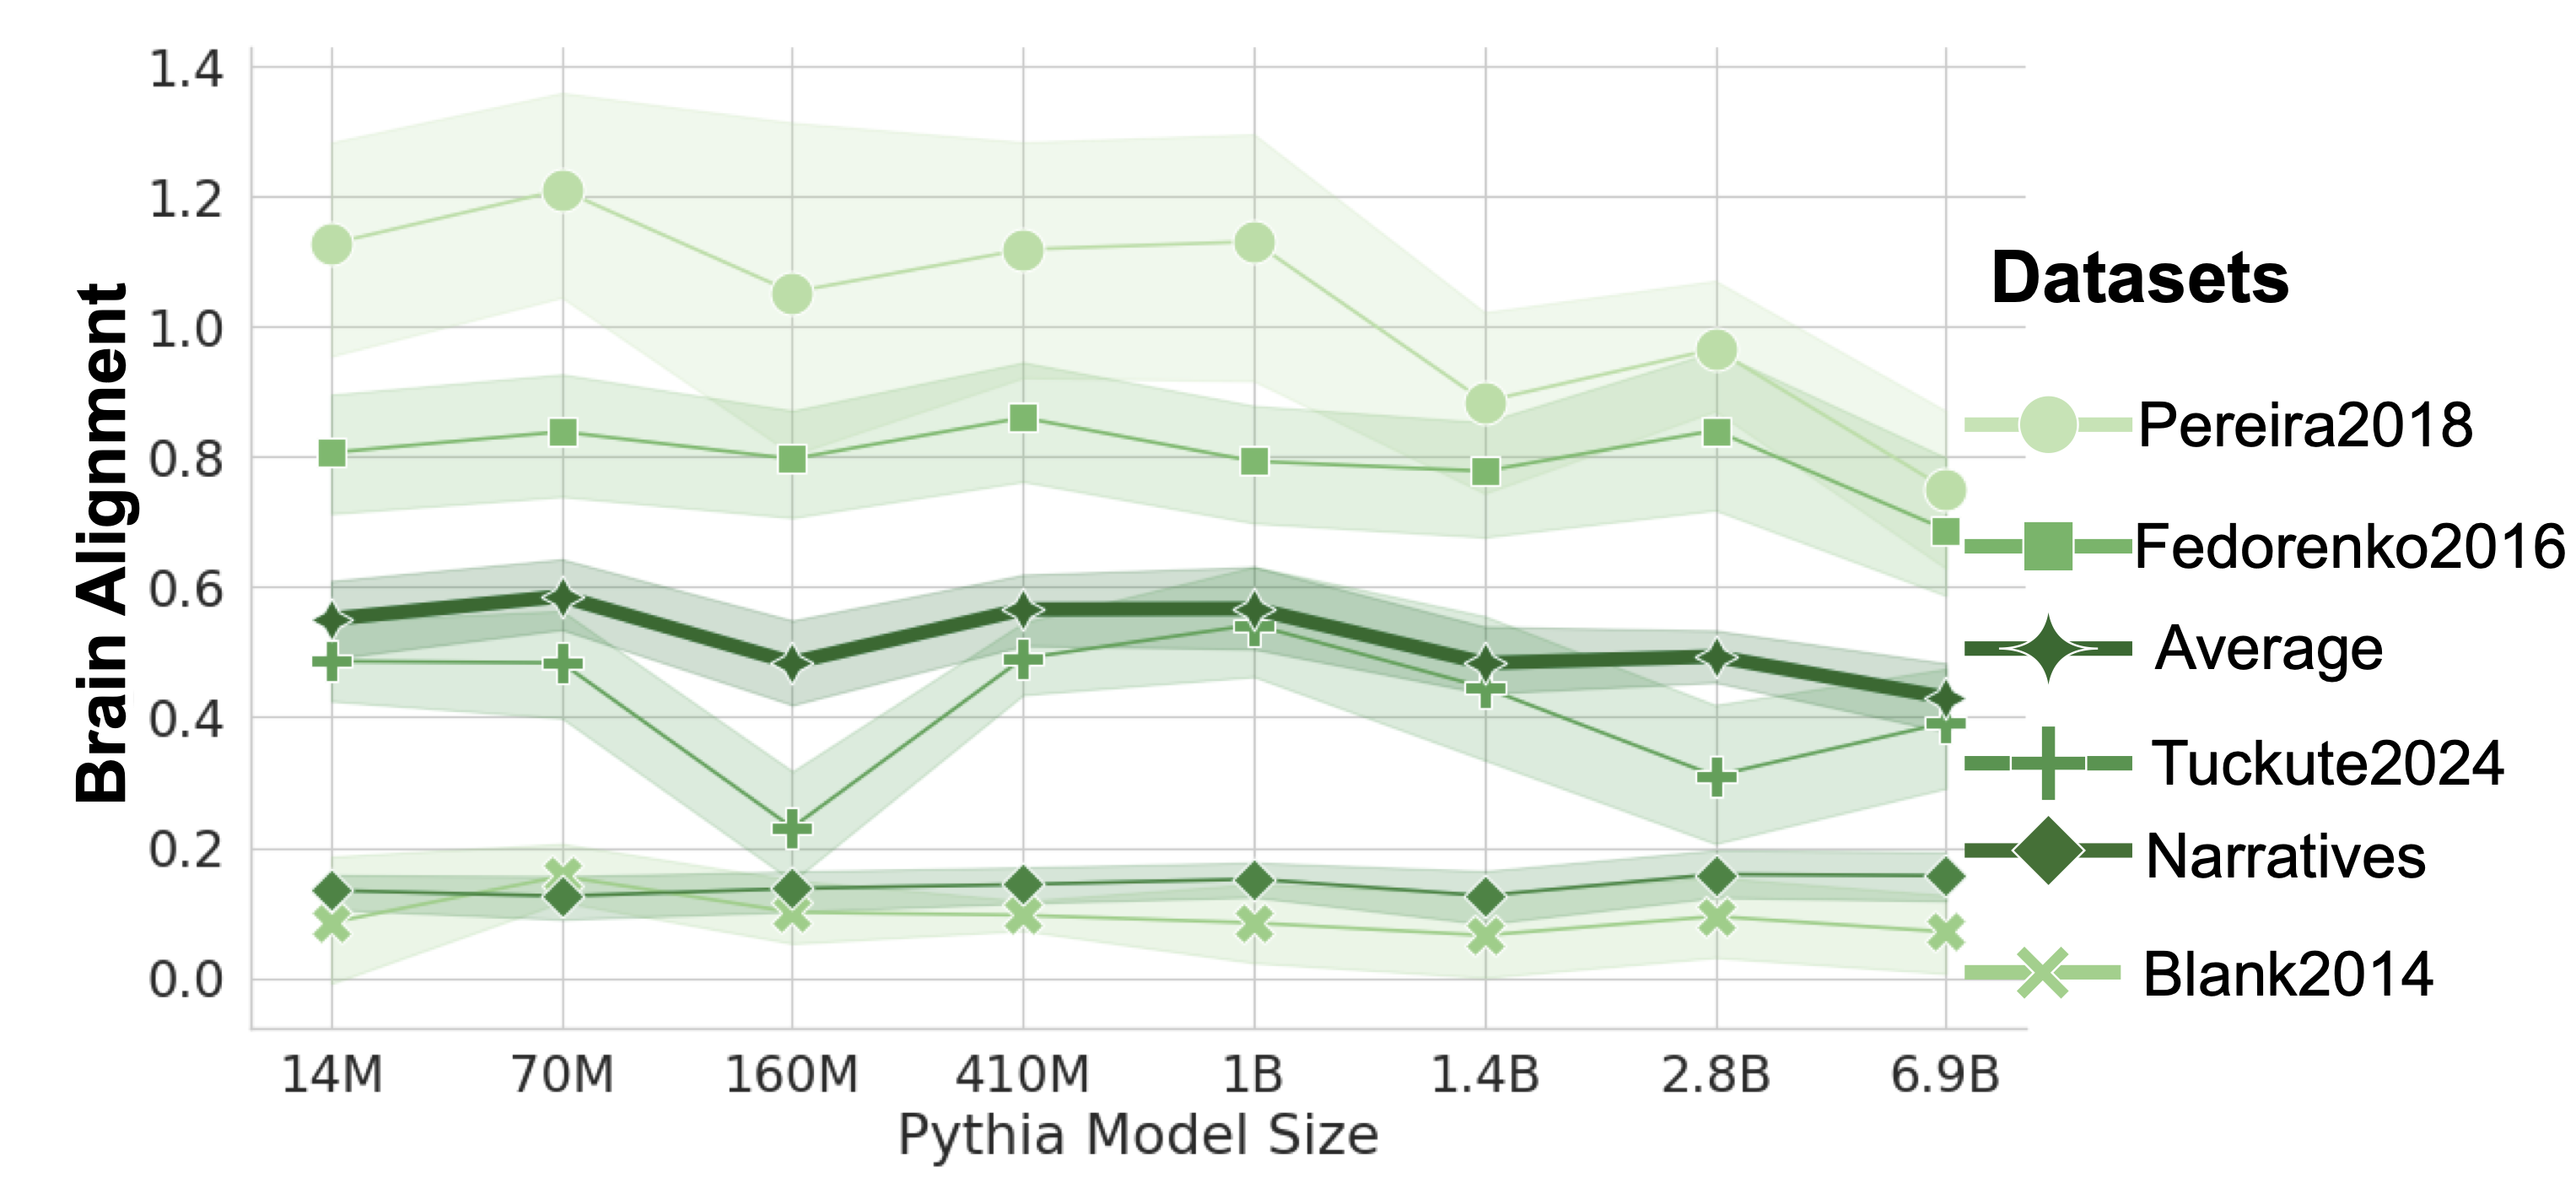
The chart visualizes brain alignment scores for multiple datasets across varying Pythia model sizes (14M to 6.9B parameters). It includes six datasets (Pereira2018, Fedorenko2016, Tuckute2024, Narratives, Blank2014, and Average) with shaded regions indicating variability/confidence intervals.
### Components/Axes
- **X-axis**: Pythia Model Size (14M, 70M, 160M, 410M, 1B, 1.4B, 2.8B, 6.9B)
- **Y-axis**: Brain Alignment (0.0 to 1.4)
- **Legend**: Located in the top-right corner, mapping datasets to symbols/colors:
- Pereira2018: Light green circles
- Fedorenko2016: Dark green squares
- Tuckute2024: Green plus signs
- Narratives: Dark green diamonds
- Blank2014: Light green crosses
- Average: Dark green stars
### Detailed Analysis
1. **Pereira2018** (light green circles):
- Starts at ~1.15 (14M), peaks at ~1.2 (70M), then declines to ~0.75 (6.9B)
- Shaded region widens significantly between 160M and 1.4B
2. **Fedorenko2016** (dark green squares):
- Stable between 0.8–0.85 across all sizes
- Sharp dip to ~0.2 at 160M, then recovers to ~0.8 (6.9B)
3. **Tuckute2024** (green plus signs):
- Peaks at ~0.6 (70M), drops to ~0.2 (160M), then fluctuates between 0.4–0.5
- Shaded region narrows at 160M, suggesting lower confidence
4. **Narratives** (dark green diamonds):
- Consistently low (~0.1–0.15) across all sizes
- Minimal variability (narrow shaded region)
5. **Blank2014** (light green crosses):
- Lowest alignment (~0.05–0.1) across all sizes
- Shaded region remains narrow
6. **Average** (dark green stars):
- Weighted mean trends downward from ~0.55 (14M) to ~0.45 (6.9B)
- Shaded region widens at 160M and 1.4B
### Key Observations
- **Model Size vs. Alignment**: Larger models (1B–6.9B) generally show lower alignment than smaller models (14M–70M), contradicting the "bigger is better" hypothesis.
- **Pereira2018 Anomaly**: The sharp decline after 70M suggests potential overfitting or task-specific limitations.
- **Tuckute2024 Dip**: The 160M model's drastic drop may indicate architectural instability or dataset incompatibility.
- **Narratives Consistency**: Low but stable alignment implies this dataset may represent a baseline or control group.
- **Average Trend**: The overall decline in alignment with model size challenges assumptions about model efficacy.
### Interpretation
The data suggests that increasing model size does not universally improve brain alignment, with some datasets (e.g., Pereira2018) showing inverted U-shaped relationships. The Average line's downward trend implies that larger models may introduce noise or inefficiencies for this specific task. The shaded regions highlight uncertainty, particularly for Pereira2018 and Tuckute2024 at mid-sized models, suggesting methodological variability or dataset-specific challenges. These findings could inform debates about optimal model scaling strategies in neuroimaging applications.