## Line Chart: Speedup vs. Number of Processing Elements
### Overview
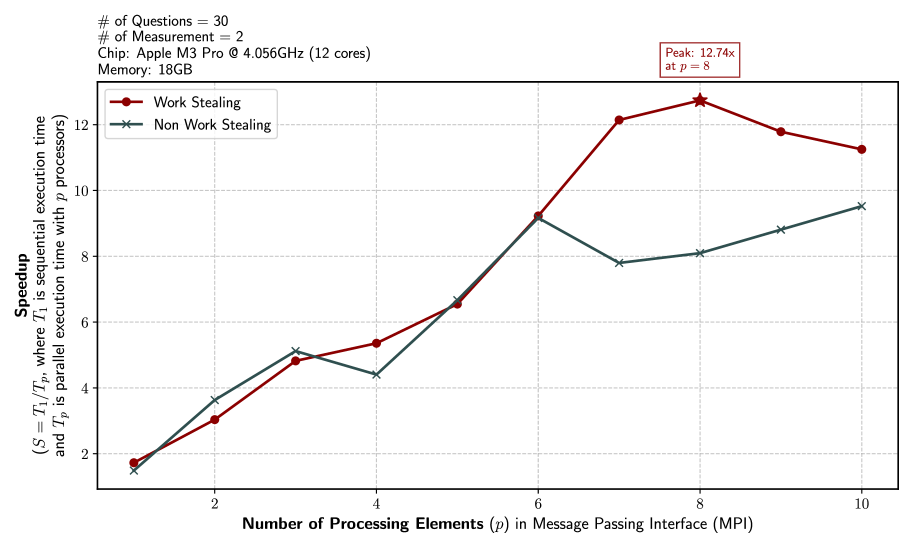
The image is a line chart comparing the speedup achieved by a "Work Stealing" and "Non Work Stealing" approach as the number of processing elements (p) increases in a Message Passing Interface (MPI). The chart displays speedup on the y-axis and the number of processing elements on the x-axis. The experiment was conducted with 30 questions and 2 measurements on an Apple M3 Pro chip @ 4.056GHz (12 cores) with 18GB of memory.
### Components/Axes
* **Title:** None explicitly present on the chart itself, but the context suggests it's a comparison of speedup with and without work stealing.
* **X-axis:** "Number of Processing Elements (p) in Message Passing Interface (MPI)". The scale ranges from 1 to 10, with integer markers at each value.
* **Y-axis:** "Speedup" represented by the formula (S = T1/Tp, where T1 is sequential execution time and Tp is parallel execution time with p processors). The scale ranges from 2 to 12, with integer markers at each value.
* **Legend:** Located in the top-center of the chart.
* **Work Stealing:** Represented by a dark red line with circular markers.
* **Non Work Stealing:** Represented by a dark green line with 'x' markers.
* **Additional Text:**
* Top-left: "# of Questions = 30", "# of Measurement = 2", "Chip: Apple M3 Pro @ 4.056GHz (12 cores)", "Memory: 18GB"
* Top-right: "Peak: 12.74x at p = 8" (associated with the Work Stealing line)
### Detailed Analysis
**Work Stealing (Dark Red Line with Circular Markers):**
* **Trend:** Initially increases rapidly, peaks at p=8, then decreases slightly.
* **Data Points:**
* p=1: Speedup ≈ 1.6
* p=2: Speedup ≈ 3.0
* p=4: Speedup ≈ 5.4
* p=6: Speedup ≈ 6.6
* p=8: Speedup ≈ 12.74 (Peak)
* p=10: Speedup ≈ 11.2
**Non Work Stealing (Dark Green Line with 'x' Markers):**
* **Trend:** Increases steadily, with a slight dip between p=6 and p=8, but does not reach the same peak as "Work Stealing".
* **Data Points:**
* p=1: Speedup ≈ 1.6
* p=2: Speedup ≈ 3.5
* p=4: Speedup ≈ 4.5
* p=6: Speedup ≈ 9.2
* p=8: Speedup ≈ 7.8
* p=10: Speedup ≈ 9.5
### Key Observations
* Both "Work Stealing" and "Non Work Stealing" approaches start with similar speedup values at p=1.
* "Work Stealing" achieves a significantly higher peak speedup (12.74x) at p=8 compared to "Non Work Stealing".
* After p=8, the speedup for "Work Stealing" decreases, while "Non Work Stealing" continues to increase slightly.
* The "Non Work Stealing" approach shows a more consistent and gradual increase in speedup as the number of processing elements increases, but it never reaches the peak performance of "Work Stealing".
### Interpretation
The data suggests that "Work Stealing" is more effective in achieving higher speedup, especially around 8 processing elements. However, its performance degrades slightly beyond this point. "Non Work Stealing" provides a more stable and consistent speedup increase, although it does not reach the same peak performance.
The choice between "Work Stealing" and "Non Work Stealing" would depend on the specific application and the number of processing elements available. If the application can effectively utilize a larger number of processing elements and needs the absolute highest speedup, "Work Stealing" at p=8 might be preferred. If stability and consistent performance across a wider range of processing elements are more important, "Non Work Stealing" might be a better choice. The slight decrease in "Work Stealing" performance after p=8 could indicate overhead or diminishing returns associated with the work-stealing mechanism as the number of processors increases.